Weekly Corn Market Update 02/05/21
December 2021 (Dec21) corn futures (the benchmark for 2021 corn production) finished the week higher by 6.50-cents (~1.46%), settling at $4.5175/bushel. This week's price action took place in an 11.50-cent (~2.58%) range, the narrowest weekly range of the year. All of this week's trading took place within the unremarkable bands we published last week.
Our corn demand index was up ~3.88% this week, outperforming Dec21 corn futures, indicating that new crop corn could have some catching up to do. See the chart below. Our concerns over COVID-19 and executive branch policy remain. We believe these factors will continue to provide potential sources of volatility for the foreseeable future. They are of particular concern where they might impact U.S. and Chinese trade relations. Next Tuesday, the USDA will release its monthly World Agricultural Supply and Demand Estimates. It seems unlikely that this report will have a significant impact coming so quickly on the heels of monthly, quarterly, and annual data a few weeks ago. Though, it is always best to prepare for the unexpected.
Technically speaking, Dec21 corn futures remain in an uptrend that started from the August 2020 lows. It is still too soon to tell if the reversal from two weeks ago will break that trend. Most daily and weekly momentum indicators are in neutral territory, though some are again signaling overbought conditions in the market. Dec21 corn futures may be forming a rising wedge that could indicate the formation of a bull trap. Additionally, carry spreads widened for the 2021 crop year despite this week's rally. We still would not be surprised by a pullback to the $4.10-$4.12/bushel range.
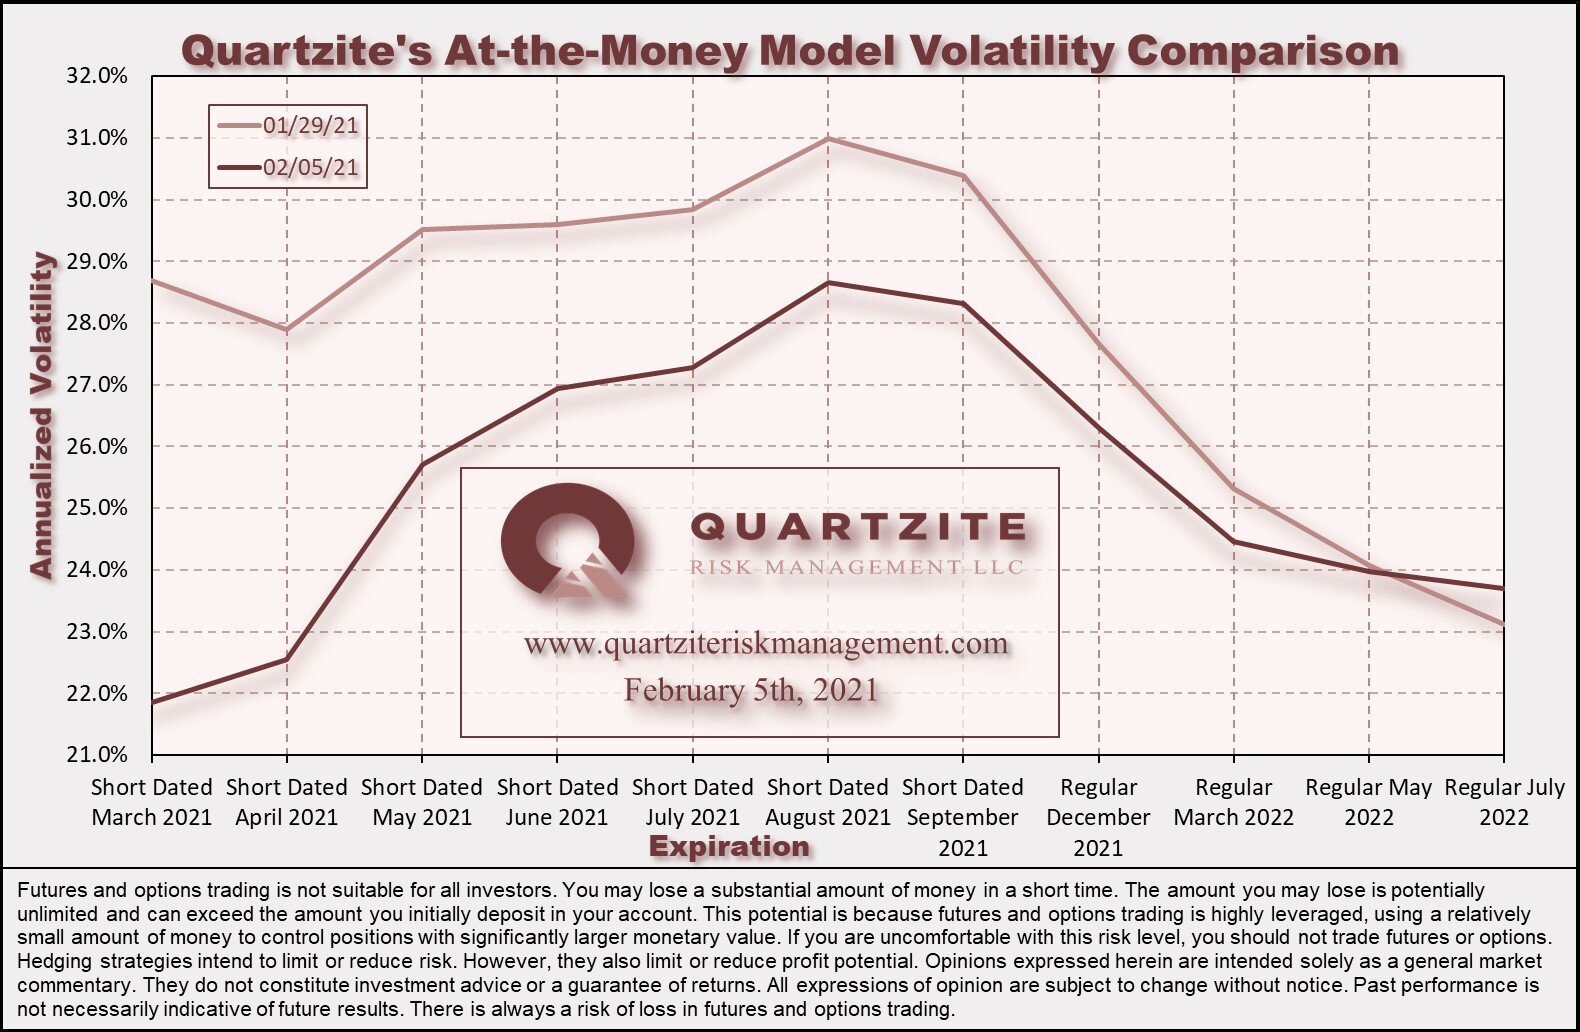
Implied volatility was lower in almost all new crop expirations this week. The front of the curve took it the worst, with short-dated March expiration collapsing 6.83%. Reasonable values for long term hedgers are still challenging to find. Opportunistic spreading and careful position management remain virtual necessities to maintain the flexibility needed to manage production uncertainty and volatility risk. That said, the volatility spread from Dec21 to Mar22 options is attractive at these levels - though it may be tricky to execute favorably given the budding liquidity in the Mar22 expiration. See the chart below for a comparison of our closing at-the-money model volatilities for this week and last.
Looking ahead to next week's trading in Dec21 corn futures, we would consider movement within the $4.3825-$4.6625 per bushel range to be unremarkable. Notable moves would extend to the $4.1875-$4.8925 per bushel range. Price action beyond that would be extreme. You will find a chart comparing these levels to the corresponding weekly price action below. Be sure to visit our Twitter page to vote in the poll we hold there each week. While you are there, please give us a follow.
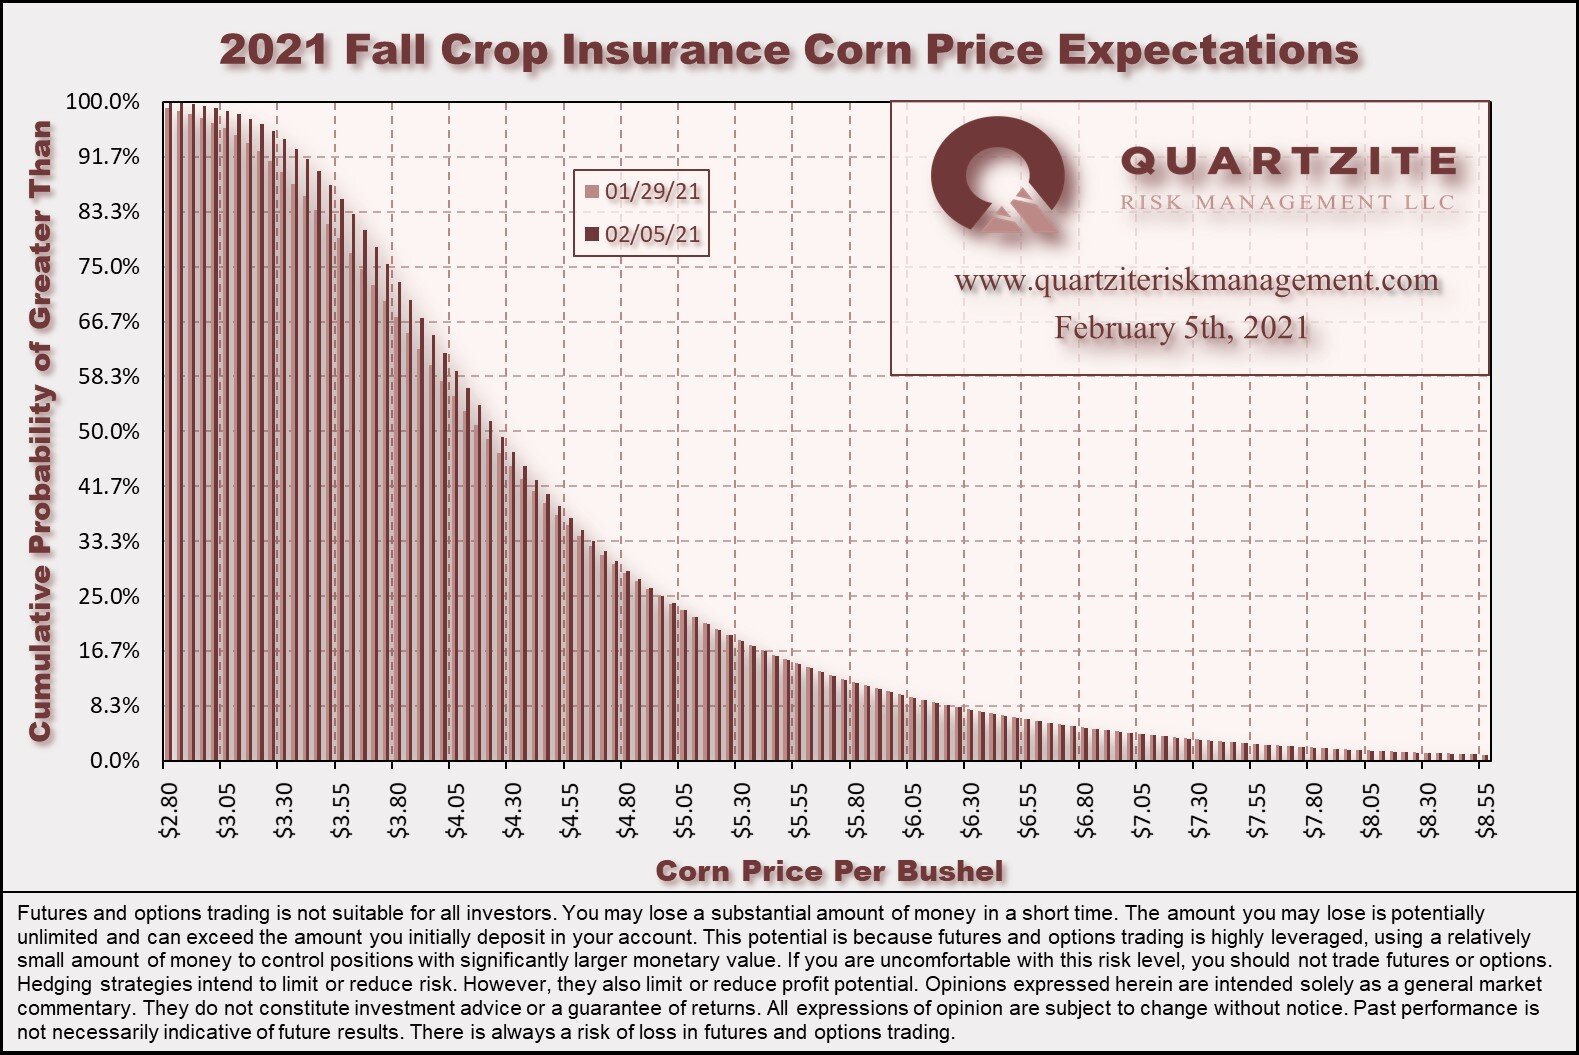
The Spring Price for crop insurance began accumulating this week. With just over a quarter of the observations collected, the average is currently $4.4985. The distribution for the Fall Price shifted slightly higher due to the rally. However, declining implied volatility left expectations for a Fall Price beyond $5.00/bushel essentially unchanged this week. See below for distribution and cumulative probability charts for Fall crop insurance prices and a chart highlighting the distribution's changes.
We began tiptoeing into hedges for our Quartzite Precision Marketing customers this week. They have been making regular forward sales with their local elevators. We have been looking for favorable option spreads to create a flexible portfolio without too much exposure to the high level of implied volatility. We generally favor the simple over the complex but elevated implied volatilities this season make simplicity a challenge. If you are interested in learning more about how we plan to navigate this season's challenges, please give us a call.
Thanks for taking the time to read. We look forward to your questions and feedback. Please feel free to contact us via our contact form, Facebook, Twitter, email, or phone at (970)294-1379. Thanks again. Have a great week.
Weekly Price Levels and Corn Demand Index


As a reminder, the Quartzite Risk Management Corn Demand Index references the weekly change in April 2022 futures for Crude Oil, Live Cattle and Lean Hogs. We weigh the percentage change in those contracts and compute the index's percentage change. Crude Oil accounts for 50% of the index, and Live Cattle and Lean Hogs each make up 25%. To create the chart, we started the index at the Dec21 corn futures settlement on 11/20/20; then added or subtracted the index's weekly percentage change. We want to add a few warnings. First, there are only a handful of data points - not much to go on. Second, the index references relatively illiquid markets - making any strategy based on it challenging to execute. Third, we expect divergences to increase as we get into the growing season when the corn market will likely look more toward supply for its direction. In short, we would not attempt to trade on this information without much more data, nor would we recommend anyone else does.