Weekly Corn Market Update 04/09/21
December 2021 (Dec21) corn futures (the benchmark for 2021 corn production) finished the week higher by 12.00-cents (~2.48%), settling at $4.9650/bushel. This week's price action took place in a 22.25-cent (~4.59%) range. The week's high was 0.50-cents above the upper-notable level we published last week.
This week, our corn demand index (CDI) fell ~0.74%, underperforming Dec21 corn futures again. Notably, this week's underperformance brought the CDI below Dec21 corn futures for the first time since January - a possible signal that a demand-driven market could be fading. See the chart below. Concerns over COVID-19 in the U.S. are mostly gone as vaccines become more widely distributed. Still, some potential problems remain with the possibility of new strains and other parts of the world considering or enacting renewed shutdowns. Uncertain executive branch policy and rising long-term interest rates (and their impact on the Dollar) remain significant concerns. We believe these factors will continue to provide potential sources of volatility for the foreseeable future. The USDA released its monthly WASDE report to little fanfare on Friday.
The uptrend that started from the August 2020 lows remains intact this week, with Dec21 trading at fresh intraday highs on Friday in addition to posting new daily and weekly high settlements. Various daily momentum indicators display neutral to overbought conditions. Weekly momentum indicators continue to show overbought conditions and bearish divergences from price action. Carry spreads from Dec21 to Mar22, May22, and Jul22 expanded this week. We continue to see significant technical levels below the market around$4.84/bushel, $4.64/bushel, $4.42/bushel, and $4.24/bushel.
Implied volatilities for the 2021 crop finished lower this week. Near term, expirations took the most damage. Reasonable values for long-term hedgers remain challenging to find. Even the forward volatility implied between Dec21 and Mar22 has risen, making the Mar22 expiration less of a good deal for long-term hedgers than it has been in weeks past. Opportunistic spreading and careful position management are still virtual necessities to maintain the flexibility needed to manage production uncertainty and volatility risk. See the charts below. One compares our closing at-the-money model volatilities for this week and last. The other compares our current model volatilities with the forward volatilities they imply between consecutive expirations.
Looking ahead to next week's trading in Dec21 corn futures, we would consider movement within the $4.8225-$5.1200 per bushel range to be unremarkable. Notable moves would extend to the $4.6675-$5.3050 per bushel range. Price action beyond that would be extreme. You will find a chart comparing these levels to the corresponding weekly price action below. Be sure to visit our Twitter page to vote in the poll we hold there each week. While you are there, please give us a follow.
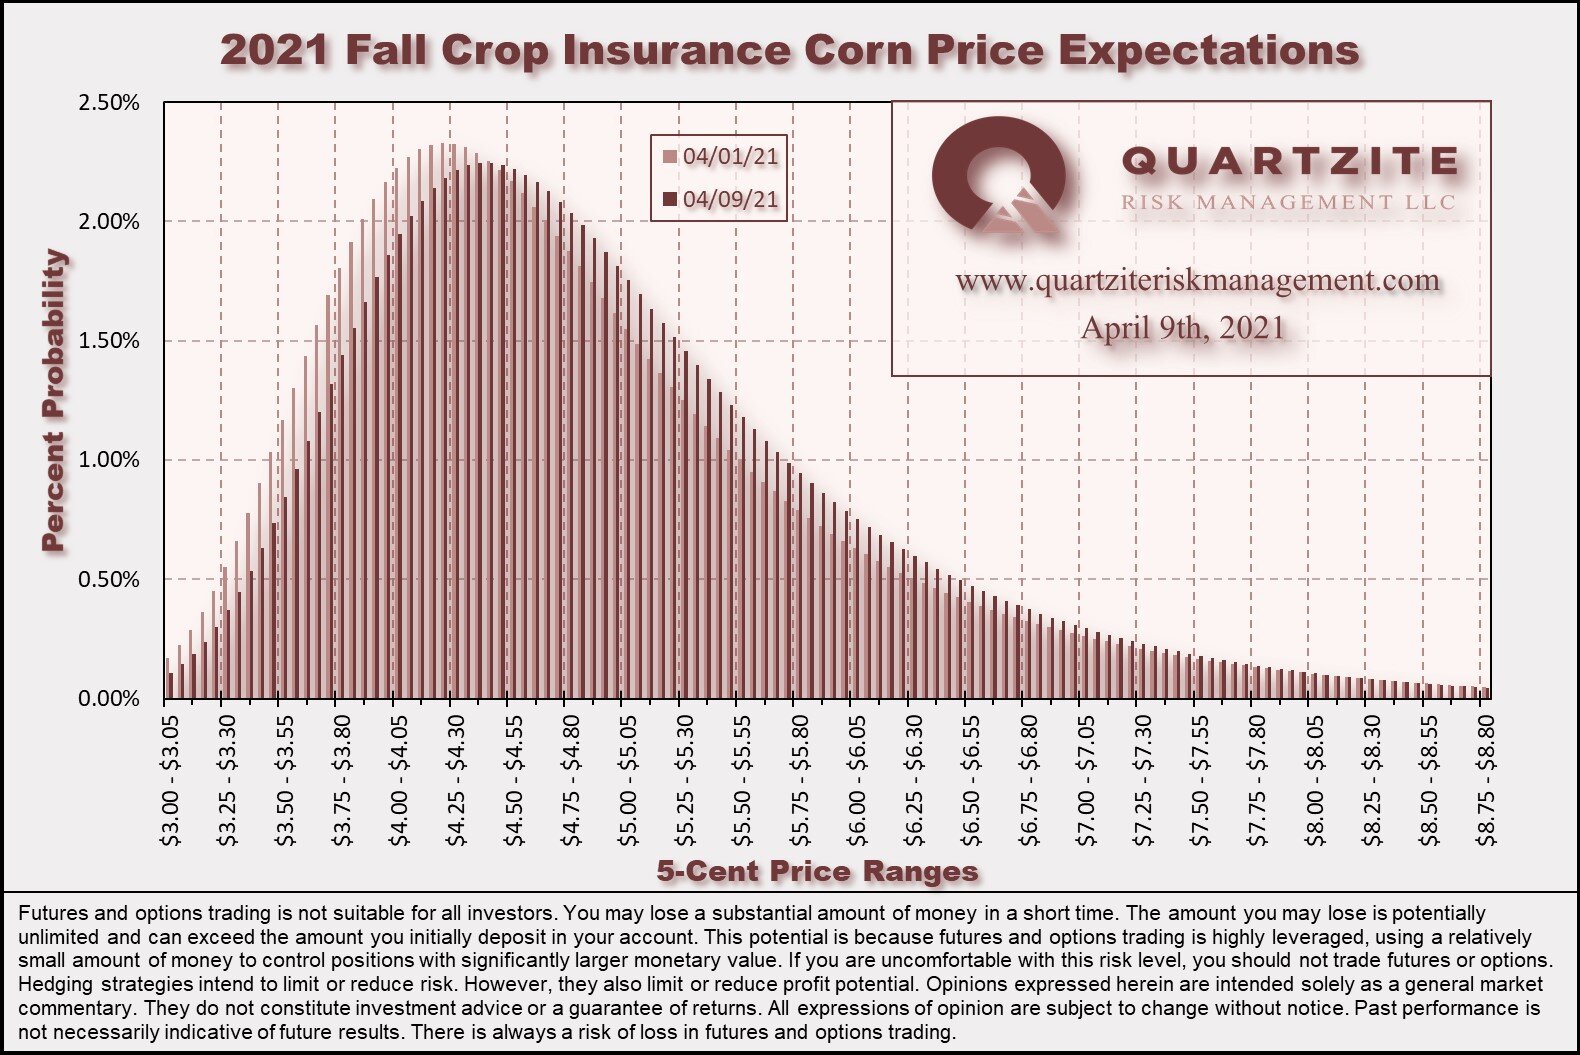
Our Crop Insurance Fall Price distribution shifted higher this week due to the selloff and narrowed due to decreased implied volatility. See below for distribution and cumulative probability charts for fall crop insurance prices and a chart highlighting the distribution's changes.
We made several trades in the corn complex for our Quartzite Precision Marketing customers this week. On Monday, we moved some of our sales back out to Jul22 after carry spreads widened following last week's compression. Tuesday, we rolled up some of our short-dated May puts on a ratio. Finally, on Thursday, we moved some short-dated May options around (mostly making small call purchases to protect trading account equity) ahead of the USDA's WASDE release on Friday. Overall, we are somewhat long the market. This length is more out of necessity than desire, but it dissipates quickly to the downside as our gamma kicks in.
Thanks for taking the time to read. We look forward to your questions and feedback. Please feel free to contact us via our contact form, Facebook, Twitter, email, or phone at (970)294-1379. Thanks again. Have a great week.
#AgTwitter & #oatt it was an interesting week. Cast your vote in this week's poll, then click over to read our Weekly #Corn #Market Update:https://t.co/T9GqpM9DNx
— Quartzite Risk Management LLC (@QuartziteRMLLC) April 10, 2021
We think these scenarios are equally likely for next week. What do you think?
Will Dec21 corn #futures settle?
Weekly Price Levels and Corn Demand Index


As a reminder, the Quartzite Risk Management Corn Demand Index references the weekly change in April 2022 futures for Crude Oil, Live Cattle and Lean Hogs. We weigh the percentage change in those contracts and compute the index's percentage change. Crude Oil accounts for 50% of the index, and Live Cattle and Lean Hogs each make up 25%. To create the chart, we started the index at the Dec21 corn futures settlement on 11/20/20; then added or subtracted the index's weekly percentage change. We want to add a few warnings. First, there are only a handful of data points - not much to go on. Second, the index references relatively illiquid markets - making any strategy based on it challenging to execute. Third, we expect divergences to increase as we get into the growing season when the corn market will likely look more toward supply for its direction. In short, we would not attempt to trade on this information without much more data, nor would we recommend anyone else does.