Weekly Corn Market Update 04/29/22
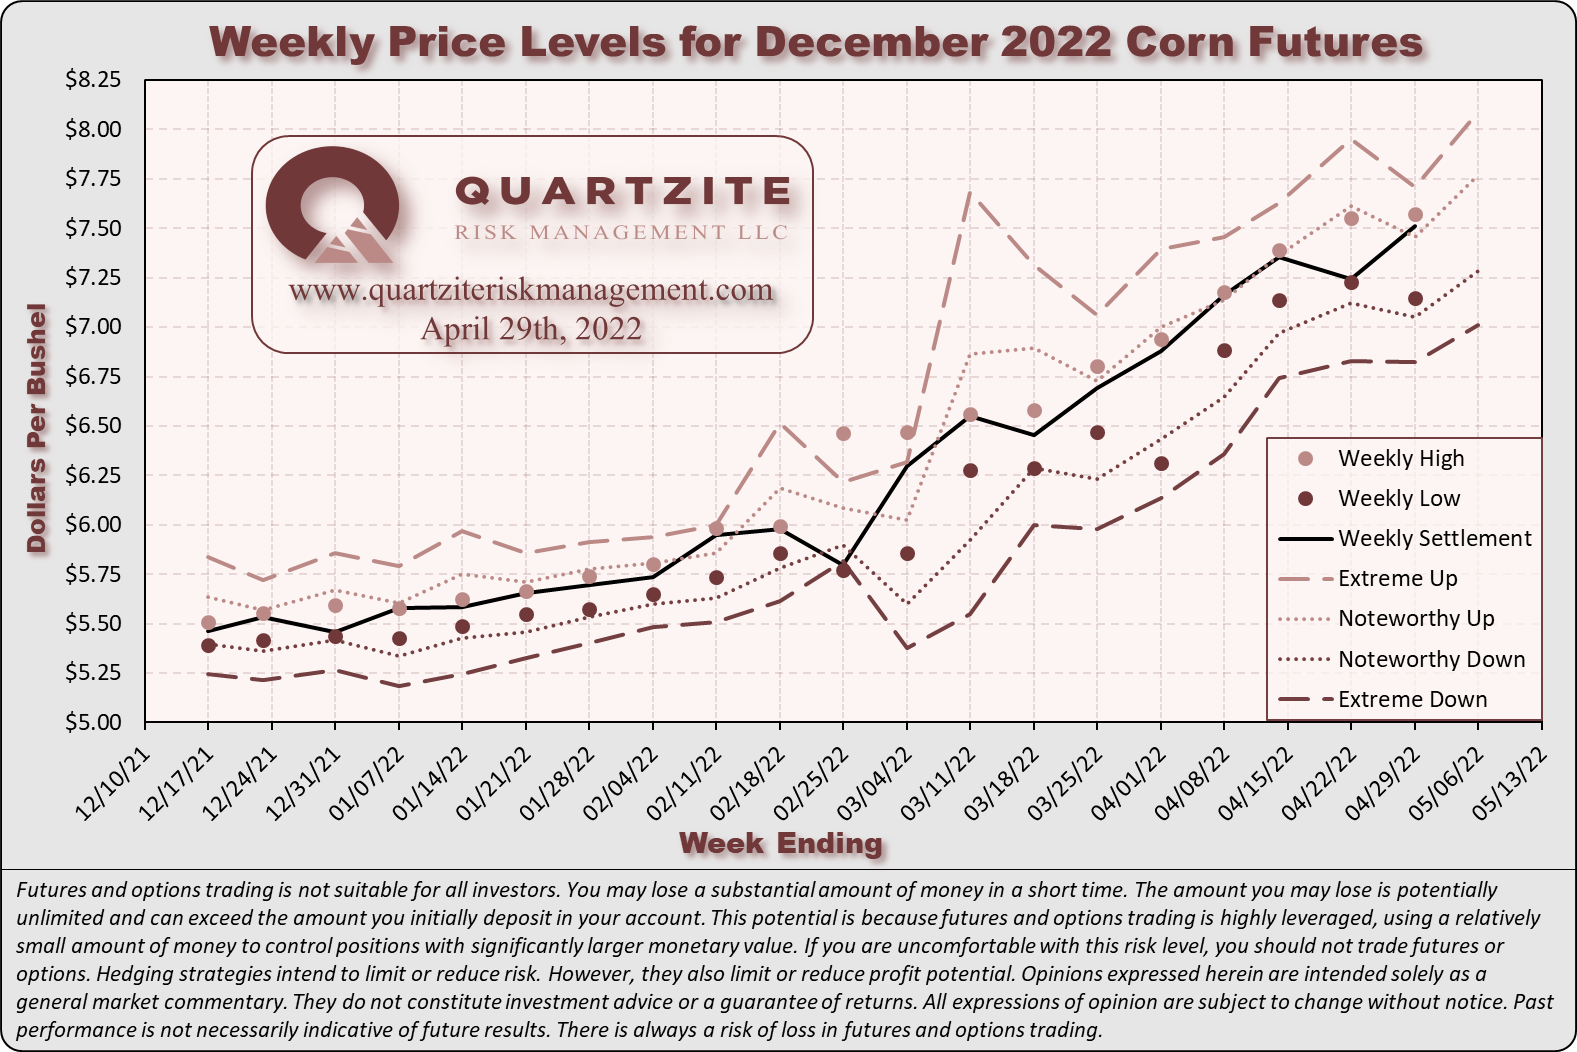
December 2022 (Dec22) corn futures (the benchmark for 2022 corn production) finished the week higher by 26.75-cents (~3.69%), settling at $7.5125/bushel. Dec22 corn futures established another new contract high of $7.5700/bushel Friday. This week's price action took place in a 42.50-cent (~5.87%) range. The week's high was 11.50-cents above the notable upper level we published last week, and the settlement was 5.75-cents above that level.
Our corn demand index (CDI) underperformed Dec22 corn futures for the sixth straight week, falling 1.56%. The CDI remains below Dec22 corn futures and continues to diverge. Russia's war with Ukraine continued dominating headlines this week, and we expect these headlines to continue driving volatility. COVID-19, executive branch policy, tensions with China, Federal Reserve interest rate policy, and the Dollar remain significant concerns. Late planting concerns seem to be affecting the market.
Dec22 corn futures remain in a long-term uptrend supported by a trendline connecting the lows of 03/31/21 and 09/10/21. Dec22 corn futures remain above the upper end of a channel formed using the 05/07/21 high as an upper boundary parallel to that trendline. We would not be surprised by a pullback testing support below the market near $7.14, $6.88, $6.58, or even $6.30/bushel. Significant long-term support is between $5.26 and $5.35 per bushel and would require a substantial break in trend to test. Most daily momentum indicators popped back into overbought territory this week, and the weeklies remain overbought. Bollinger Bands narrowed this week. Carry spreads from Dec22 to Mar23 and May23 widened again this week. The spread to Jul23 moved from an inversion to a small carry from Dec22 futures.
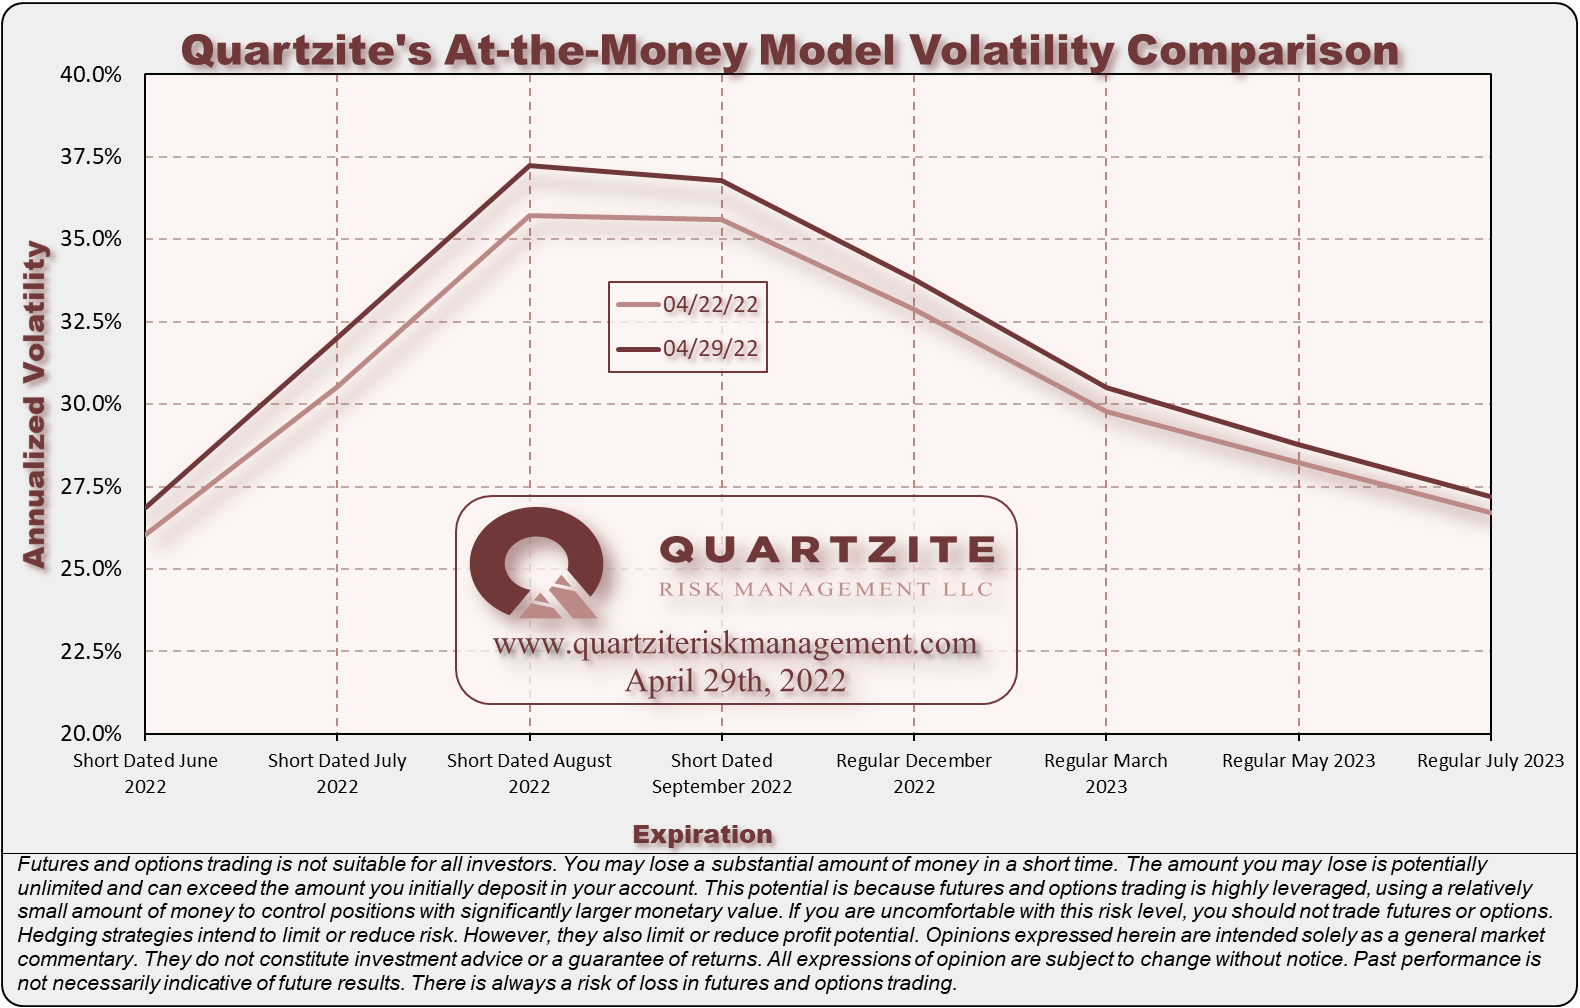
Our at-the-money model volatilities for the 2022 crop finished higher this week. Given the high implied volatilities in the options market, we believe opportunistic spreading and careful position management are crucial to managing production uncertainty and volatility risk. Cautious execution remains essential in deferred expirations because of a lack of liquidity. See the charts below for more details. One compares our closing at-the-money model volatilities for this week and last. The other compares our current model volatilities with the forward volatilities they imply between consecutive expirations.
For next week's trading in Dec22 corn futures, we consider trade in the $7.2825-$7.7675 per bushel range unremarkable. Notable moves extend to the $7.0125-$8.0900 per bushel range. Price action beyond that would be extreme. Be sure to visit our Twitter page to vote in the poll we hold there each week. While you are there, please give us a follow.
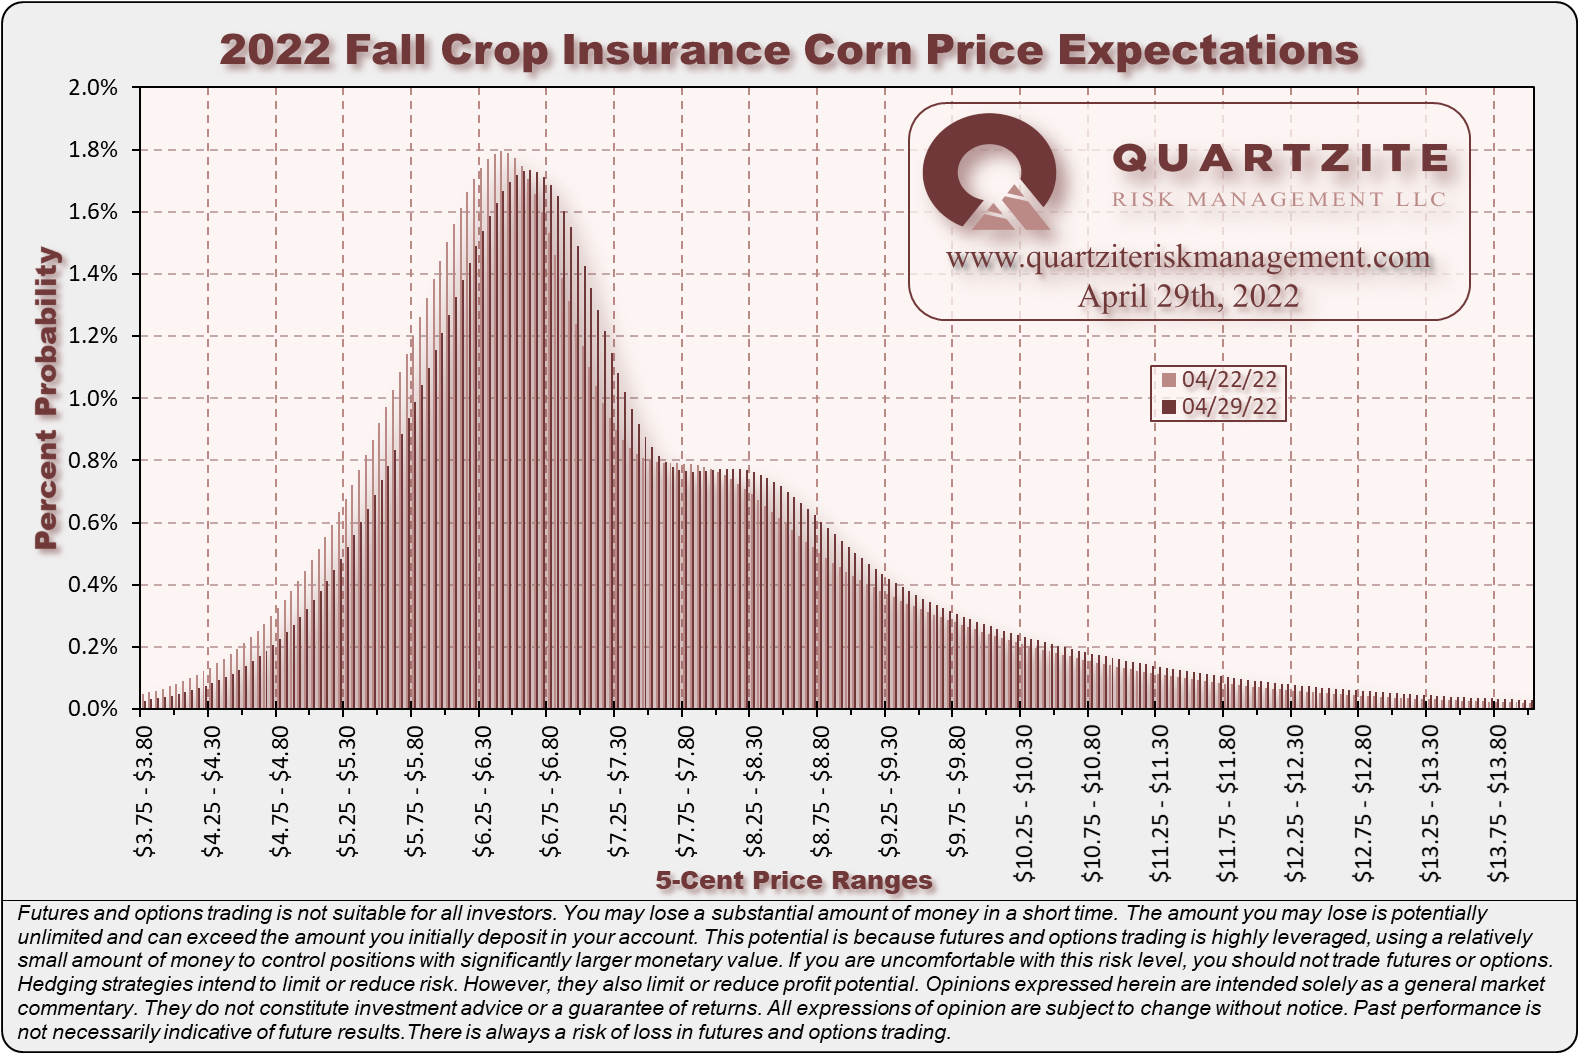
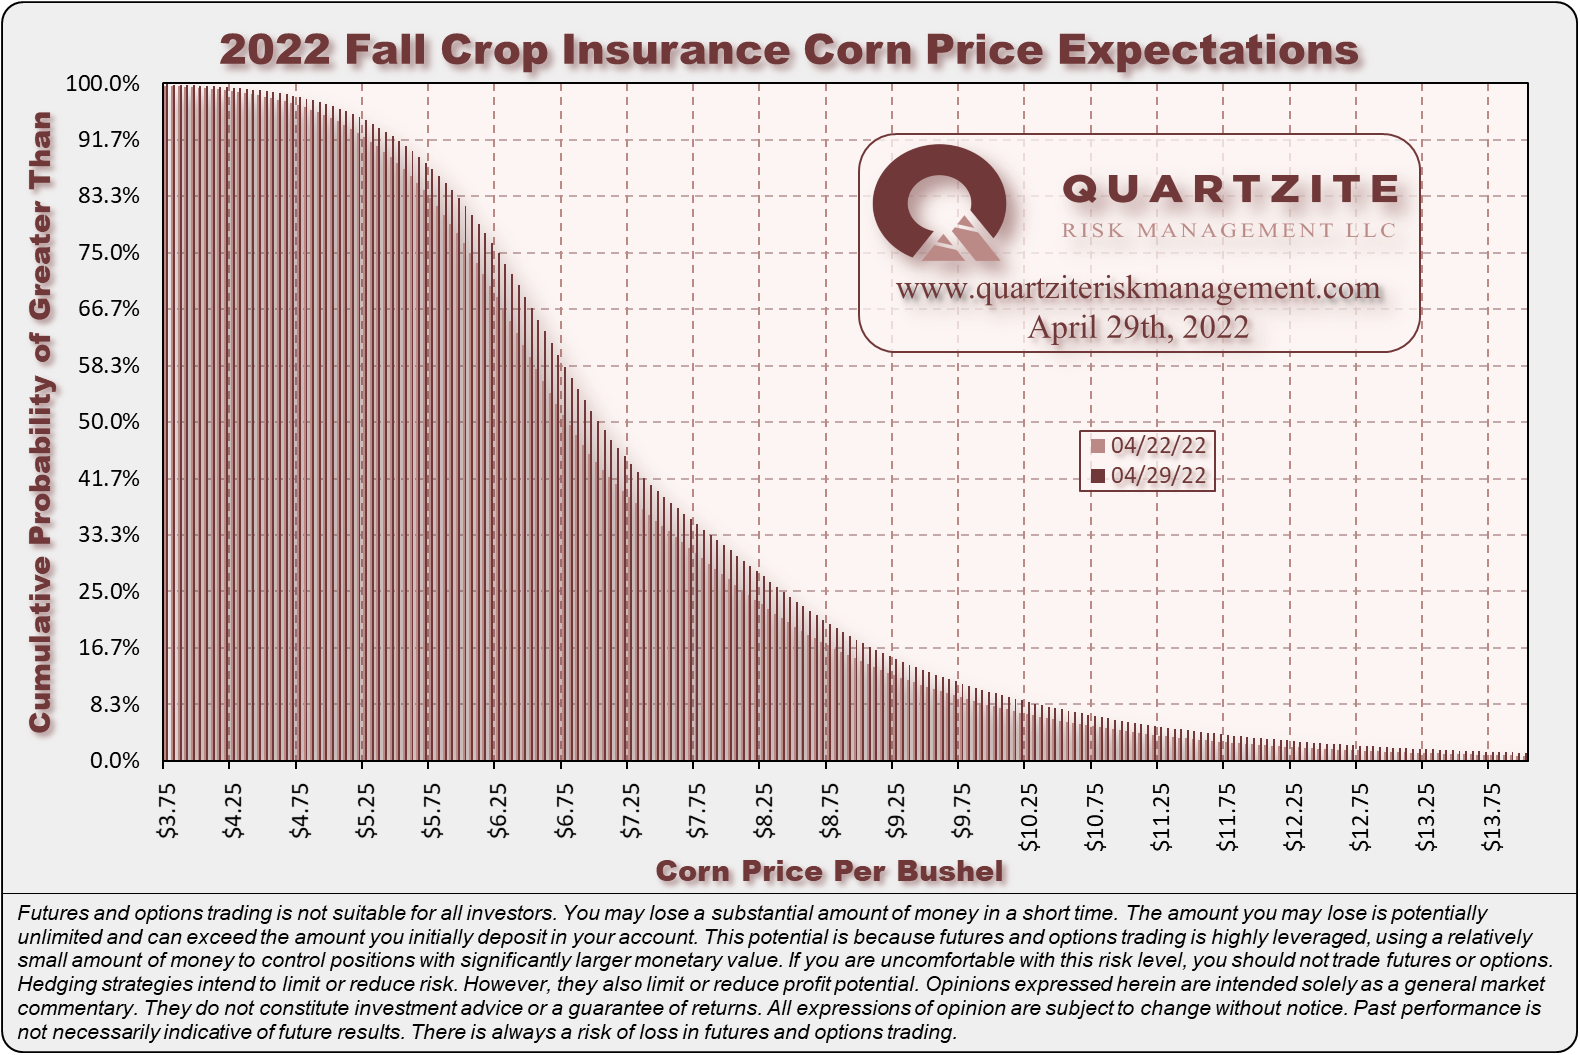
Our median Fall Price estimate is $7.0075 per bushel this week, with a mode between $6.60 and $6.65. This week, the Fall Price distribution shifted higher with the rally. It also widened with increased implied volatility.
This week, we were relatively quiet for our Quartzite Precision Marketing customers in the new crop corn market. We rolled some short-dated June puts up nearer to the money on Wednesday's strength. We also made an additional small futures trade on Wednesday to continue onboarding a new client. We still believe that producers should protect their investment in expensive inputs with a disciplined and flexible risk management strategy like the one at the heart of Quartzite Precision Marketing. There is still time to consider your 2022 marketing plan. If you have any questions or want to learn more about what we do, please reach out. We are always happy to chat about the markets, and there is no obligation.
#AgTwitter & #oatt - cast your vote in this week's poll, then click over to read our Weekly #Corn #Market Update:https://t.co/MPm4jgS0Bj…
— Quartzite Risk Management LLC (@QuartziteRMLLC) April 29, 2022
We think these scenarios are equally likely for next week. Where will Dec22 corn #futures settle?
Thanks for taking the time to read. We look forward to your questions and feedback. Thanks again. Have a great week.
(970)223-5297 - Email - Contact Form - Twitter - Facebook
Weekly Price Levels and Corn Demand Index

As a reminder, the Quartzite Risk Management Corn Demand Index references the weekly change in April 2023 futures for Crude Oil, Live Cattle and Lean Hogs. We weigh the percentage change in those contracts and compute the index's percentage change. Crude Oil accounts for 50% of the index, and Live Cattle and Lean Hogs each make up 25%. To create the chart, we started the index at the Dec22 corn futures settlement on 11/12/21; then added or subtracted the index's weekly percentage change. We want to add a few warnings. First, there are only a handful of data points - not much to go on. Second, the index references relatively illiquid markets - making any strategy based on it challenging to execute. Third, we expect divergences to increase as we get into the growing season when the corn market will likely look more toward supply for its direction. In short, we would not attempt to trade on this information without much more data, nor would we recommend anyone else does.