Weekly Corn Market 05/03/24
December 2024 (Dec24) corn futures (the benchmark for 2024 corn production) finished the week higher by 9.25 cents (~1.95%), settling at $4.8275/bushel. This week's price action occurred in a 20.25-cent (~4.28%) range. This week's high was 2.75 cents above the notable up level we published last week, and the settlement was 0.75 cents below the same level.
Our corn demand index (CDI) fell 2.29% this week, underperforming Dec24 corn futures. The war in Ukraine, executive branch policy, tensions with China, Federal Reserve interest rate policy, the Dollar, and instability in the Middle East remain concerns. The USDA releases its monthly WASDE report next Friday.
Dec24 corn futures remain inside a long-term downtrend channel capped by a trendline connecting the highs of April 20th, 2022, and June 21st, 2023, and supported by a trendline connecting the lows of July 22nd, 2022, and May 18th, 2023. One could now reasonably draw a short-term uptrend trendline connecting the lows of February 26th, 2024, and April 19th, 2024. We see technical levels below the market at around $4.73, $4.57, $4.41, and $4.14/bushel. We see technical levels above the market at about $4.86, $5.01, $5.14, $5.25, $5.44, $5.76, $5.90, and $6.02/bushel. Daily and weekly momentum indicators remain in neutral to overbought territory. The 50-day moving average is below the market near $4.6899/bushel. You might read some ado in the media about the newly-upsloping nature of the 50-day; ultimately, that simply means we closed higher today than 50 days ago. Carry spreads from Dec24 to Mar25, May25, and Jul25 narrowed this week.
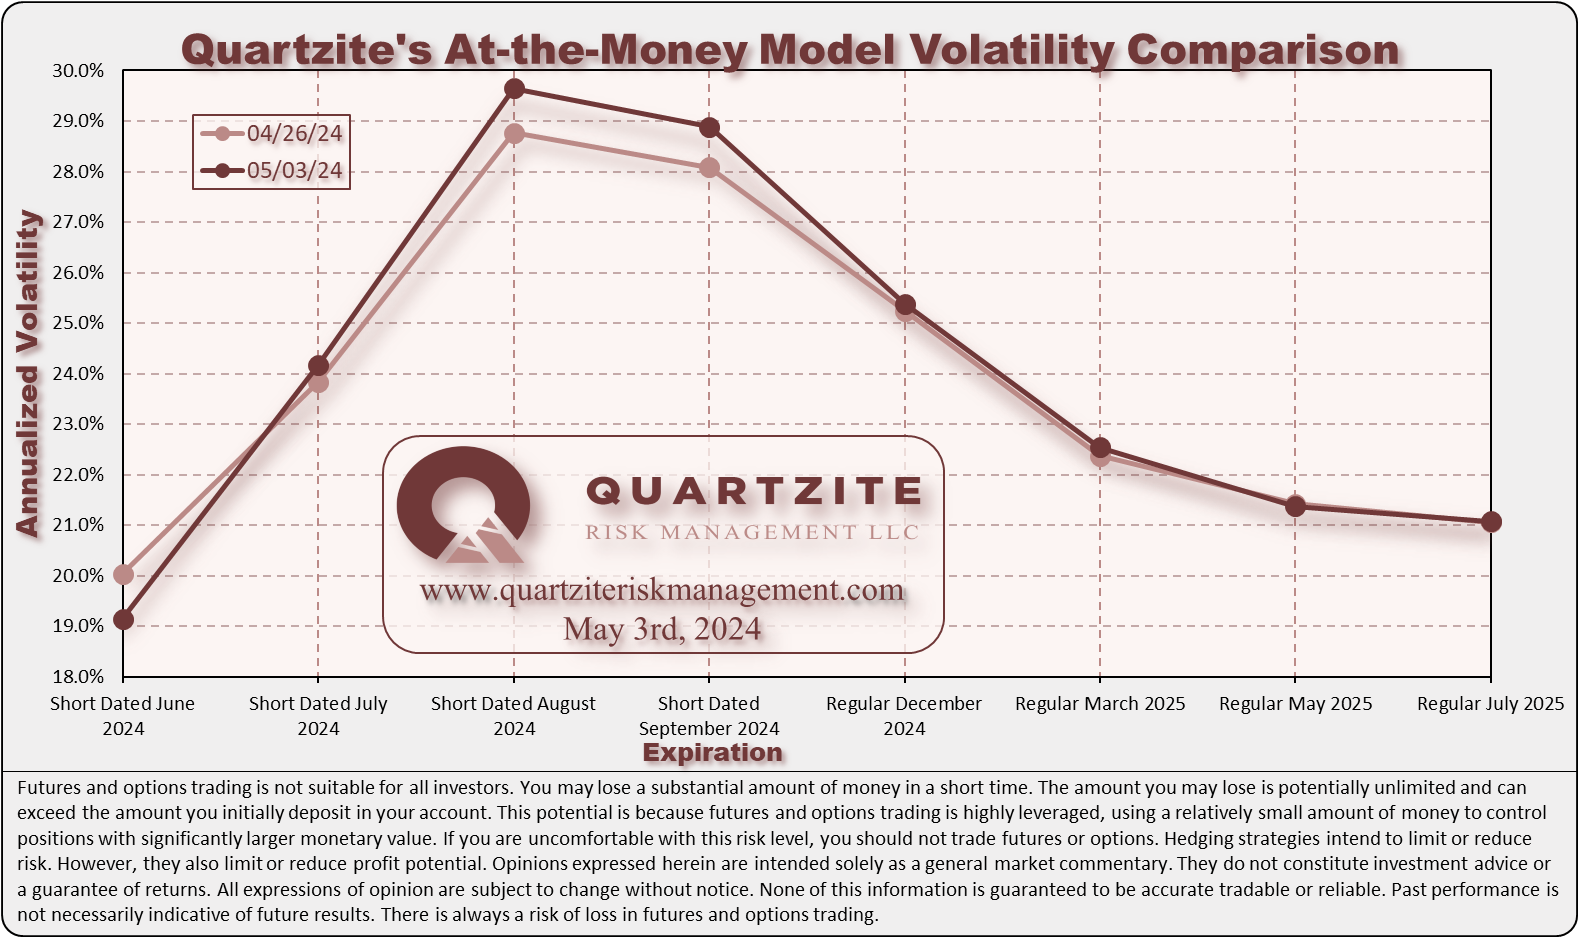
Our at-the-money model volatilities for the 2024 crop finished mostly unchanged-to-higher this week, with short-dated June the only significant exception. See the charts below for more details. One compares our closing at-the-money model volatilities for this week and last. The other compares our current model volatilities with the forward volatilities they imply between consecutive expirations.
For next week's trading in Dec24 corn futures, we consider trade in the $4.7300-$4.9325 per bushel range unremarkable. Notable moves extend to the $4.6000-$5.0850 per bushel range. Price action beyond that would be extreme.
For the fall crop insurance price, we see a median of $4.6550/bushel with a mode between $4.40 and $4.45/bushel. See the crop insurance charts below.
#AgTwitter & #oatt - cast your vote in this week's poll, then click over to read our Weekly #Corn #Market Update: https://t.co/l7EBcX38zw
— Quartzite James (@QuartziteRMLLC) May 3, 2024
We think these scenarios have roughly equal probability next week. Where do you think #cbot Dec24 corn #futures will settle next week?
Thanks for taking the time to read. We look forward to your questions and feedback. Thanks again.
(970)223-5297 - Email - Contact Form - Twitter - Facebook
Weekly Price Levels and Corn Demand Index


As a reminder, the Quartzite Risk Management Corn Demand Index references the weekly change in April 2025 futures for Crude Oil, Live Cattle and Lean Hogs. We weigh the percentage change in those contracts and compute the index's percentage change. Crude Oil accounts for 50% of the index, and Live Cattle and Lean Hogs each make up 25%. To create the chart, we started the index at the Dec24 corn futures settlement on 11/10/23; then added or subtracted the index's weekly percentage change. We want to add a few warnings. First, there are only a handful of data points - not much to go on. Second, the index references relatively illiquid markets - making any strategy based on it challenging to execute. Third, we expect divergences to increase as we get into the growing season when the corn market will likely look more toward supply for its direction. In short, we would not attempt to trade on this information without much more data, nor would we recommend anyone else does.