Weekly Corn Market Update 05/07/21
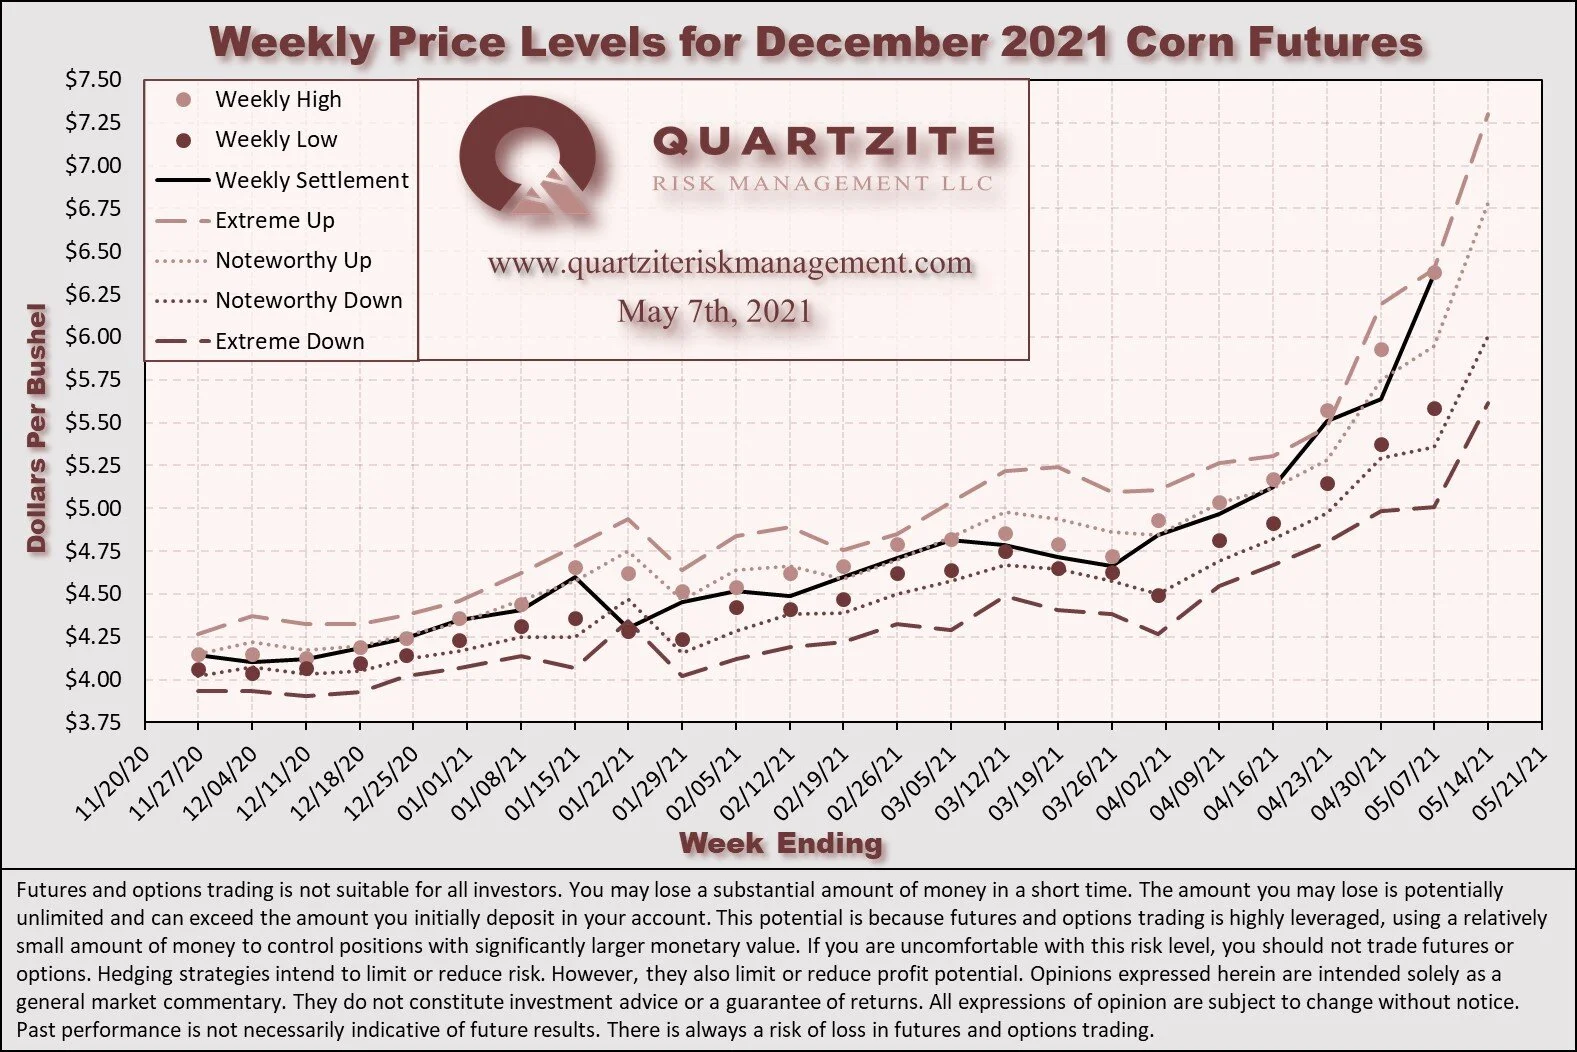
December 2021 (Dec21) corn futures (the benchmark for 2021 corn production) finished the week higher by 72.75-cents (~12.90%), settling at $6.3650/bushel - a record weekly increase for the contract in both percentage and nominal terms. This week's price action took place in a 79.25-cent (~14.06%)range, also a contract record. The week's high was 1.50-cents below the upper-extreme level we published last week, and the week's settlement was 3-cents below that level.
This week, our corn demand index (CDI) rose ~3.07%, continuing to underperform Dec21 corn futures. See the chart below. Concerns over COVID-19 in the U.S. are mostly gone. Still, as the recent outbreak in India demonstrates, the potential for problems elsewhere in the world remains. Uncertain executive branch policy, interest rates, and their impact on the Dollar remain significant concerns. We believe these factors will continue to provide potential sources of volatility for the foreseeable future. Next week Wednesday, the USDA releases its monthly WASDE report.
The uptrend that started from the August 2020 lows remains intact this week, with Dec21 posting a fresh contract high for the sixth straight week. Various daily and weekly momentum indicators display exceptionally overbought conditions. Carry spreads from Dec21 to Mar22, May22, and Jul22 narrowed considerably this week.
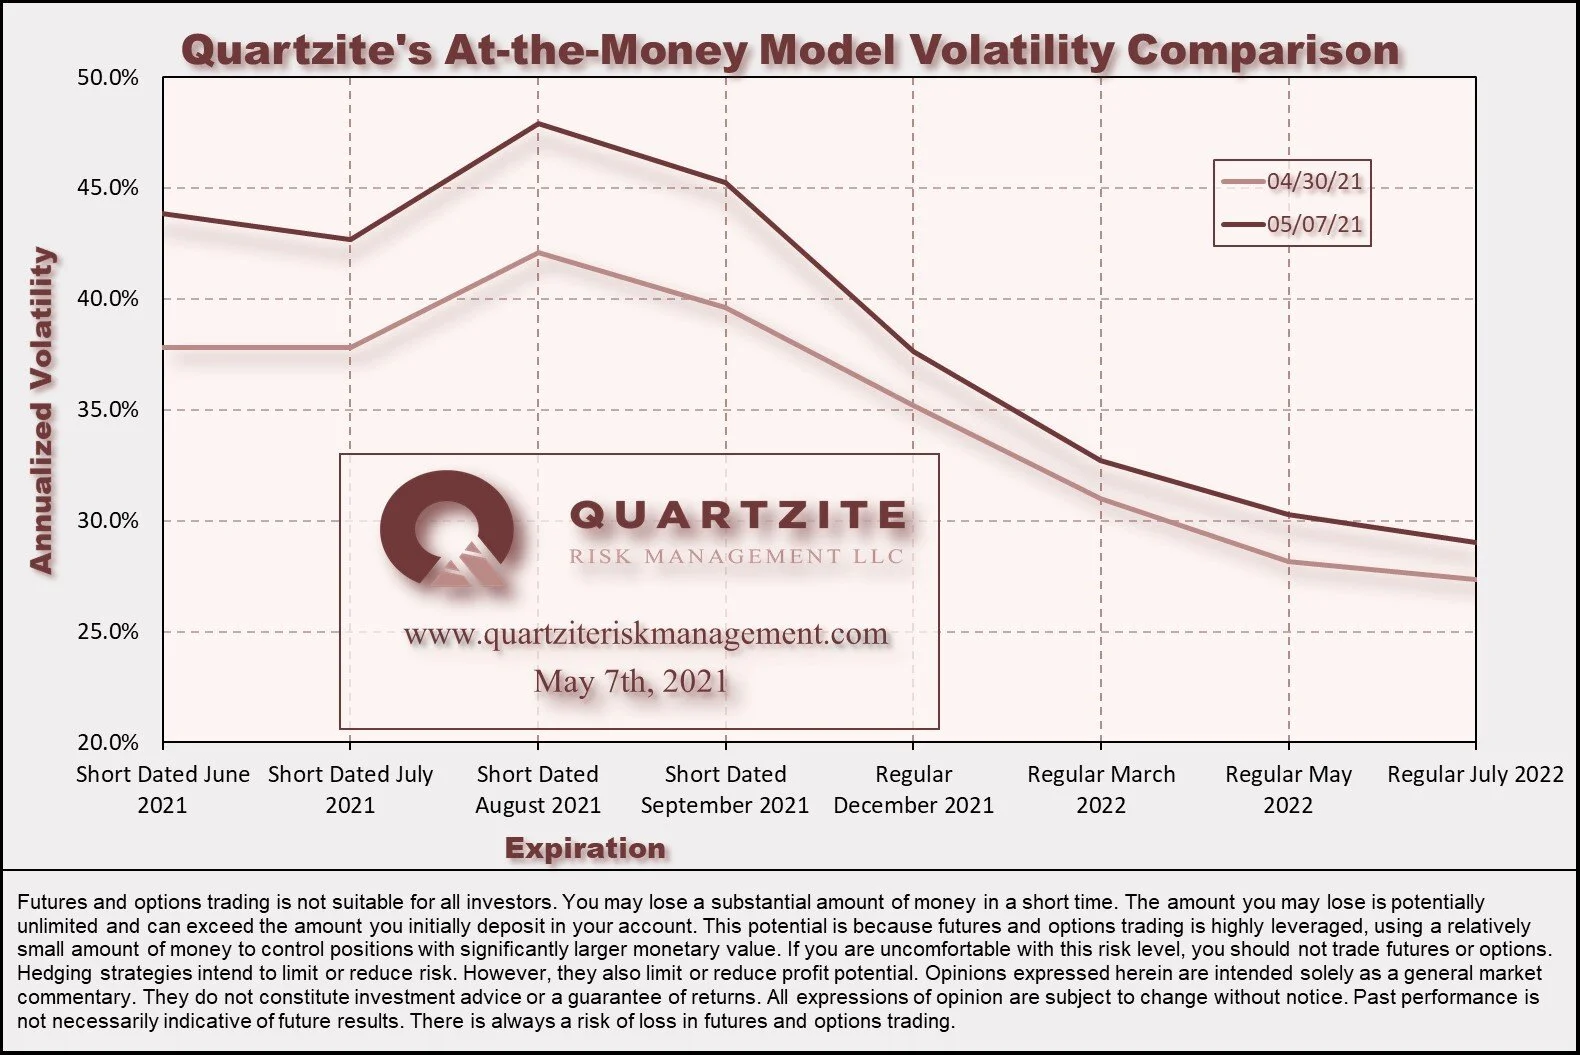
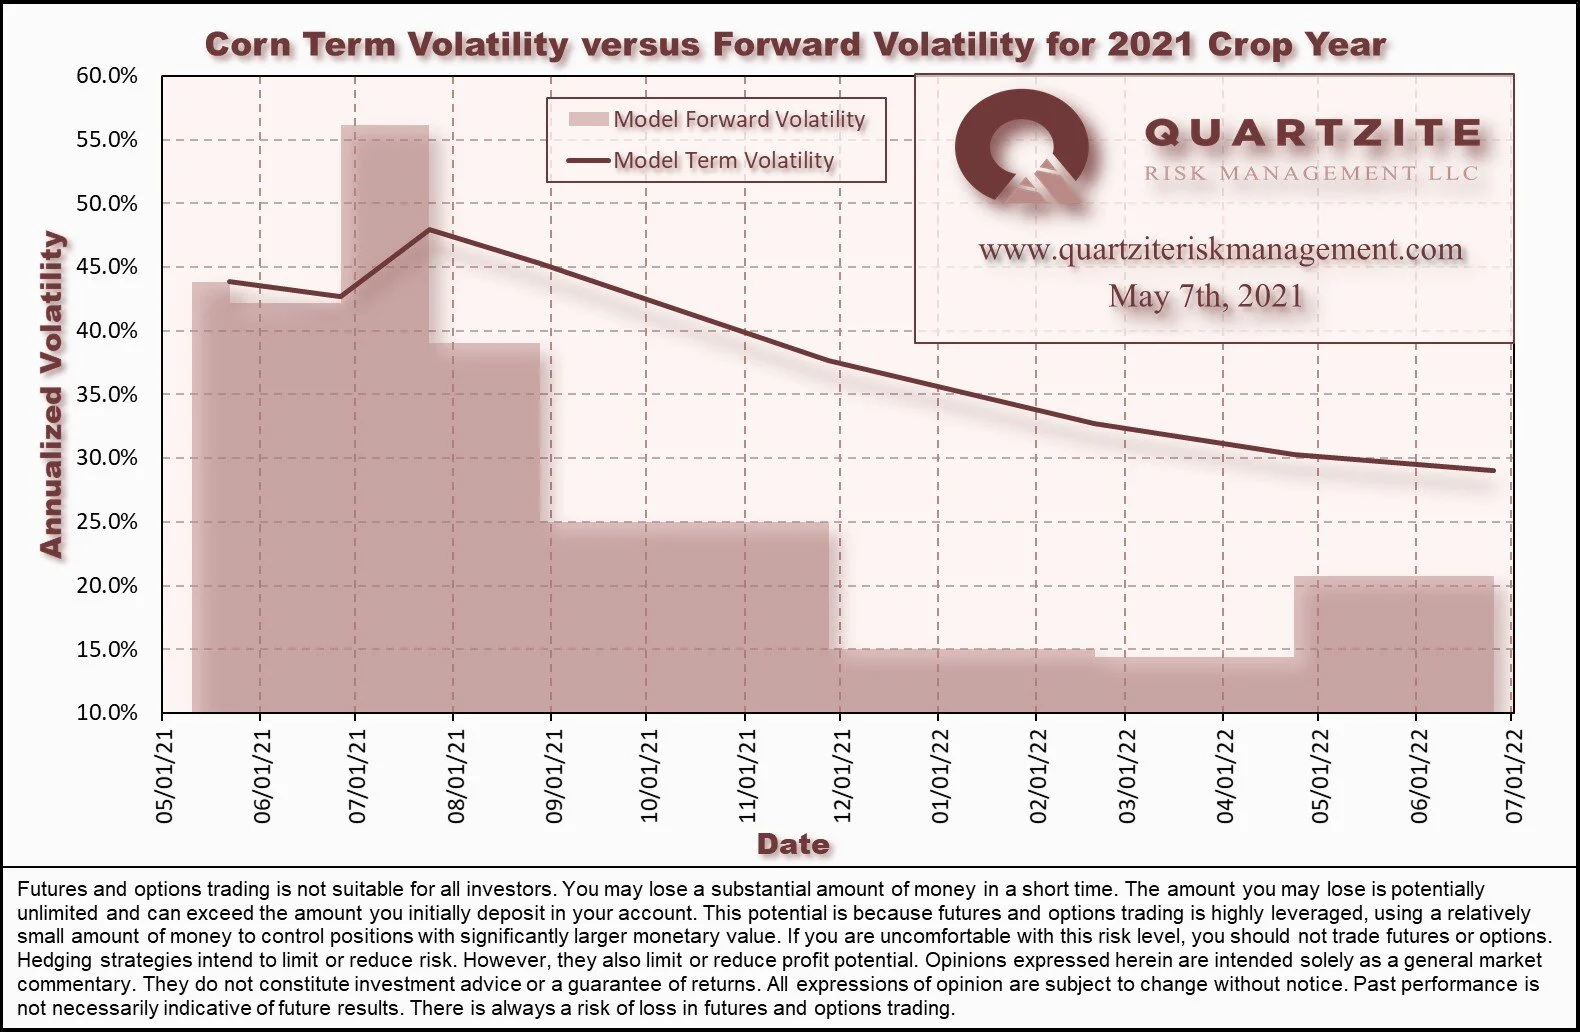
Implied volatilities for the 2021 crop finished higher on the week, with the short-dated June expiration leading the pack again. Reasonable values for long-term hedgers are extremely challenging to find at these levels. Mar22 and May22 are our preferred expirations - see the forward volatility chart below for an explanation. Opportunistic spreading and careful position management are still virtual necessities to maintain the flexibility needed to manage production uncertainty and volatility risk. See the charts below for more details. One compares our closing at-the-money model volatilities for this week and last. The other compares our current model volatilities with the forward volatilities they imply between consecutive expirations.
Looking ahead to next week's trading in Dec21 corn futures, we would consider movement within the $6.0075-$6.7825 per bushel range to be unremarkable. Notable moves would extend to the $5.6150-$7.300 per bushel range. Price action beyond that would be extreme. You will find a chart comparing these levels to the corresponding weekly price action below. Be sure to visit our Twitter page to vote in the poll we hold there each week. While you are there, please give us a follow.
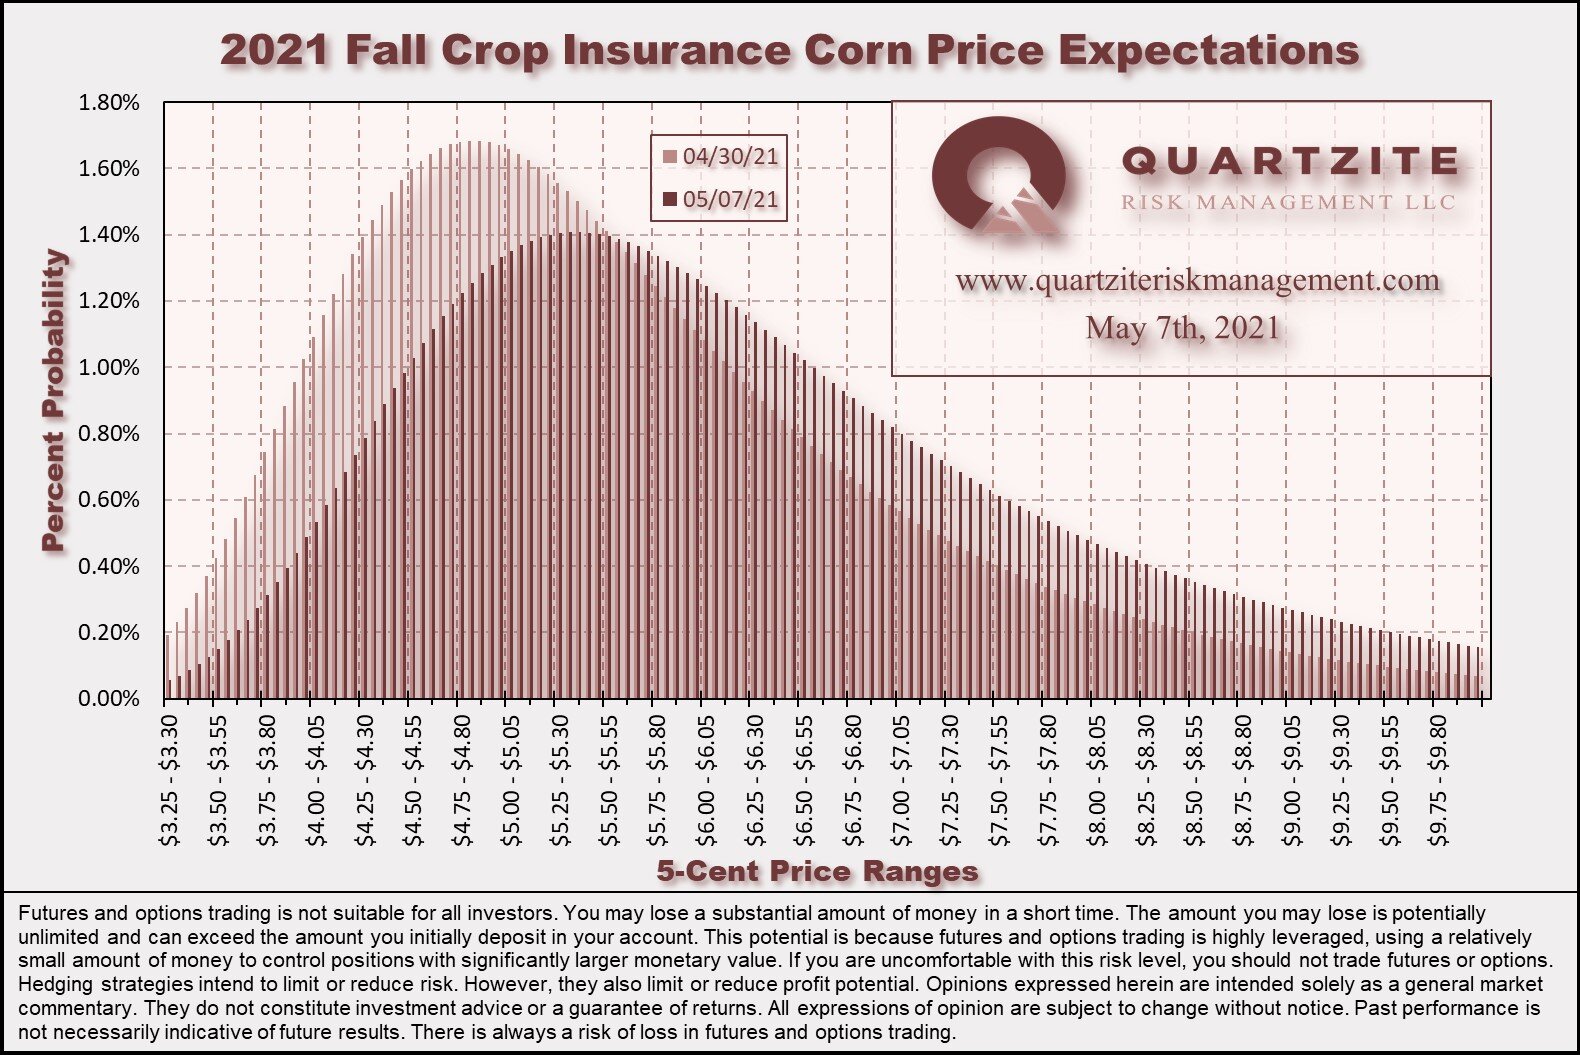
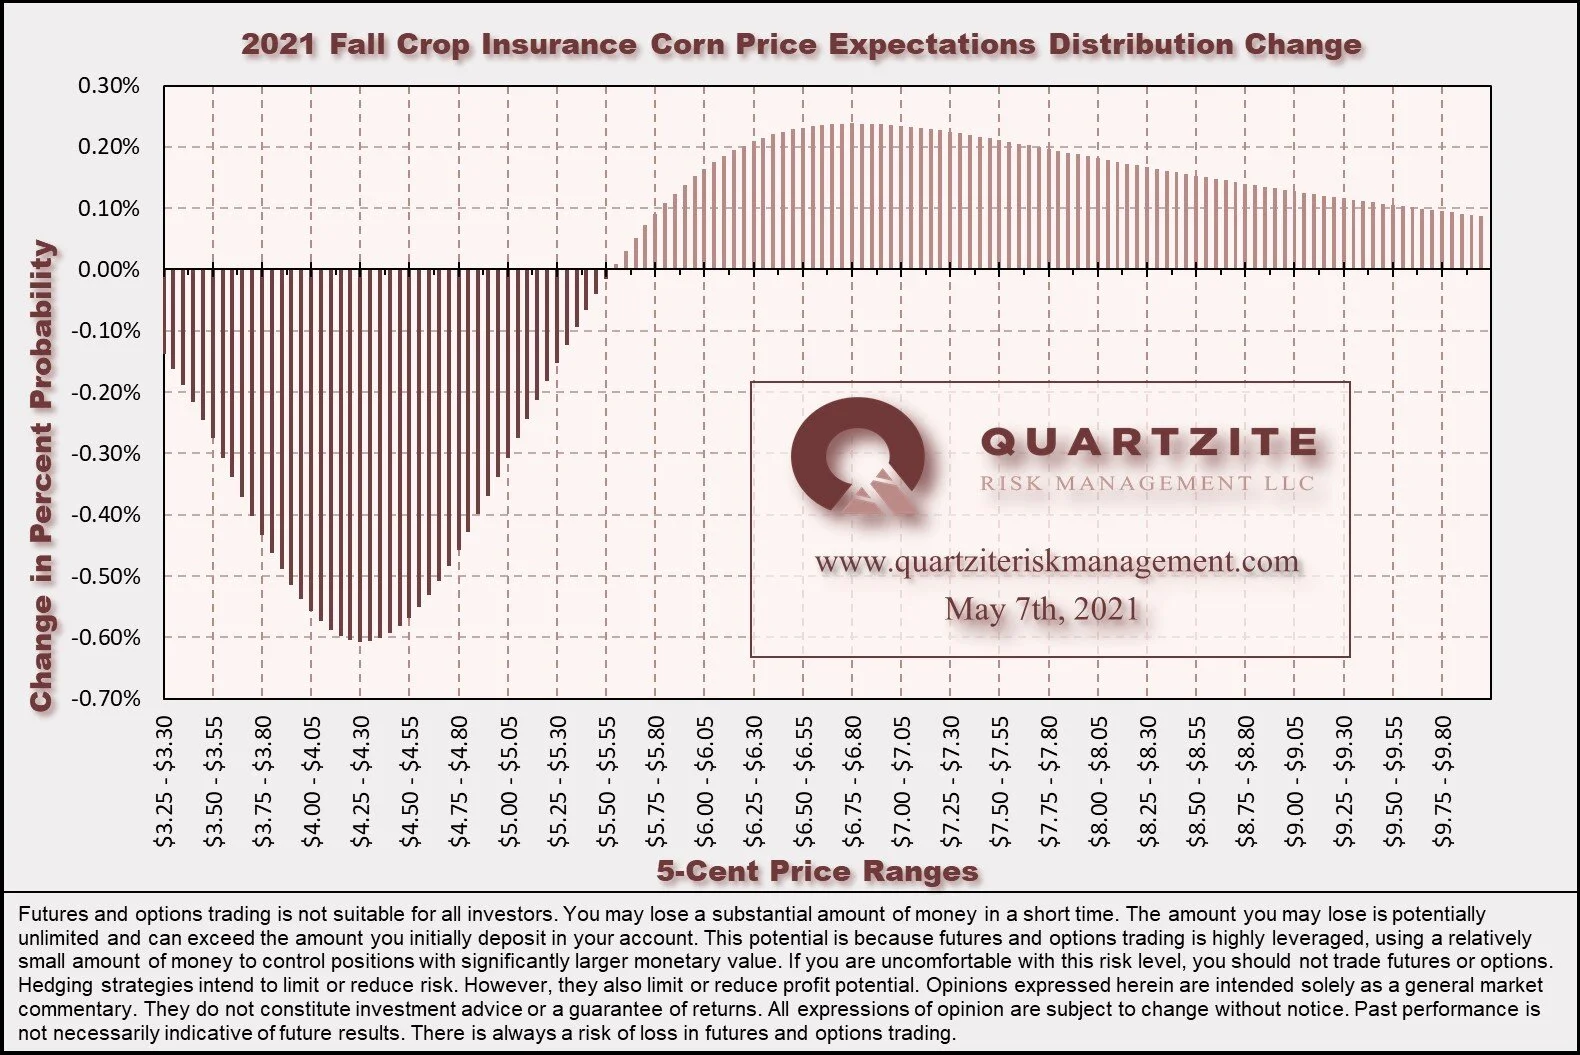
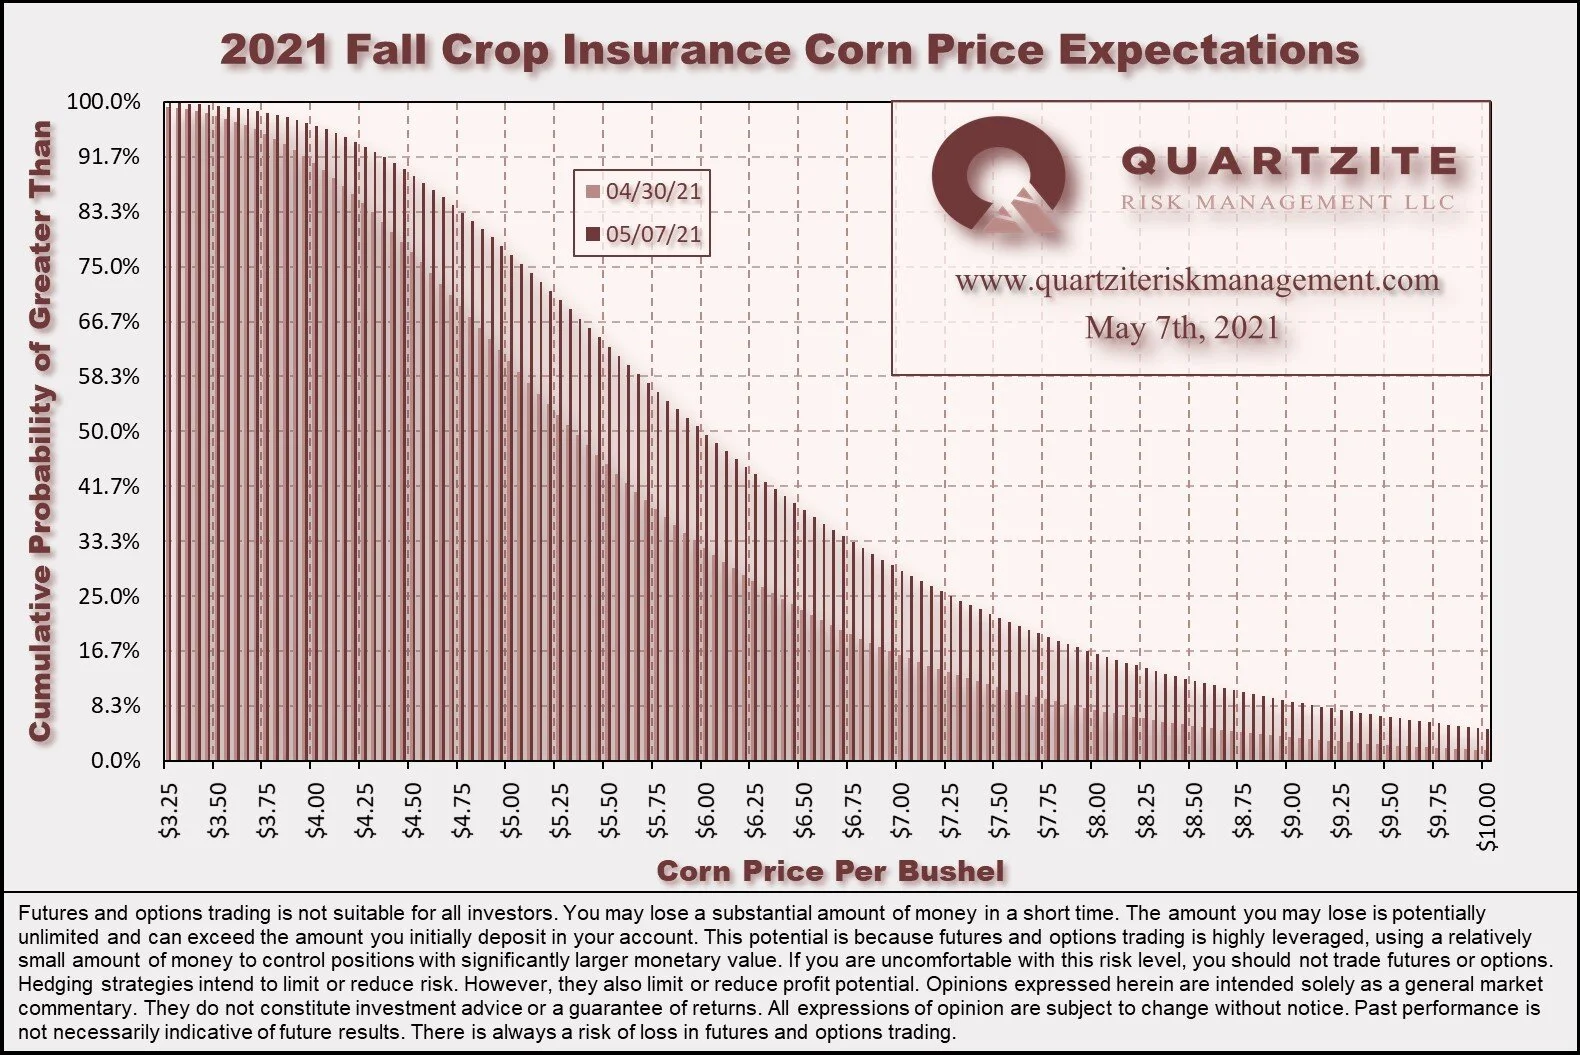
Our Crop Insurance Fall Price distribution shifted higher this week due to the rally. The distribution also widened considerably due to increases in implied volatility. See below for distribution and cumulative probability charts for fall crop insurance prices and a chart highlighting the distribution's changes.
We were relatively inactive in the corn complex for our Quartzite Precision Marketing customers this week. We used the rally as an opportunity to roll puts up. We also used the increase in short-dated Jun implied volatility to extend some of our options' duration. In addition, we used the compression of carry-spreads to bring longer-term sales forward, essentially. Overall, we remain somewhat long the market. This length is still more out of necessity than desire but dissipates to the downside as our options kick in.
Thanks for taking the time to read. We look forward to your questions and feedback. Please feel free to contact us via our contact form, Facebook, Twitter, email, or phone at (970)294-1379. Thanks again. Have a great week.
#AgTwitter & #oatt Another week, another new high. Cast your vote in this week's poll, then click over to read our Weekly #Corn #Market Update:https://t.co/4xYJ0hf26T
— Quartzite Risk Management LLC (@QuartziteRMLLC) May 8, 2021
We think these scenarios are equally likely for next week. What do you think?
Will Dec21 corn #futures settle?
Weekly Price Levels and Corn Demand Index
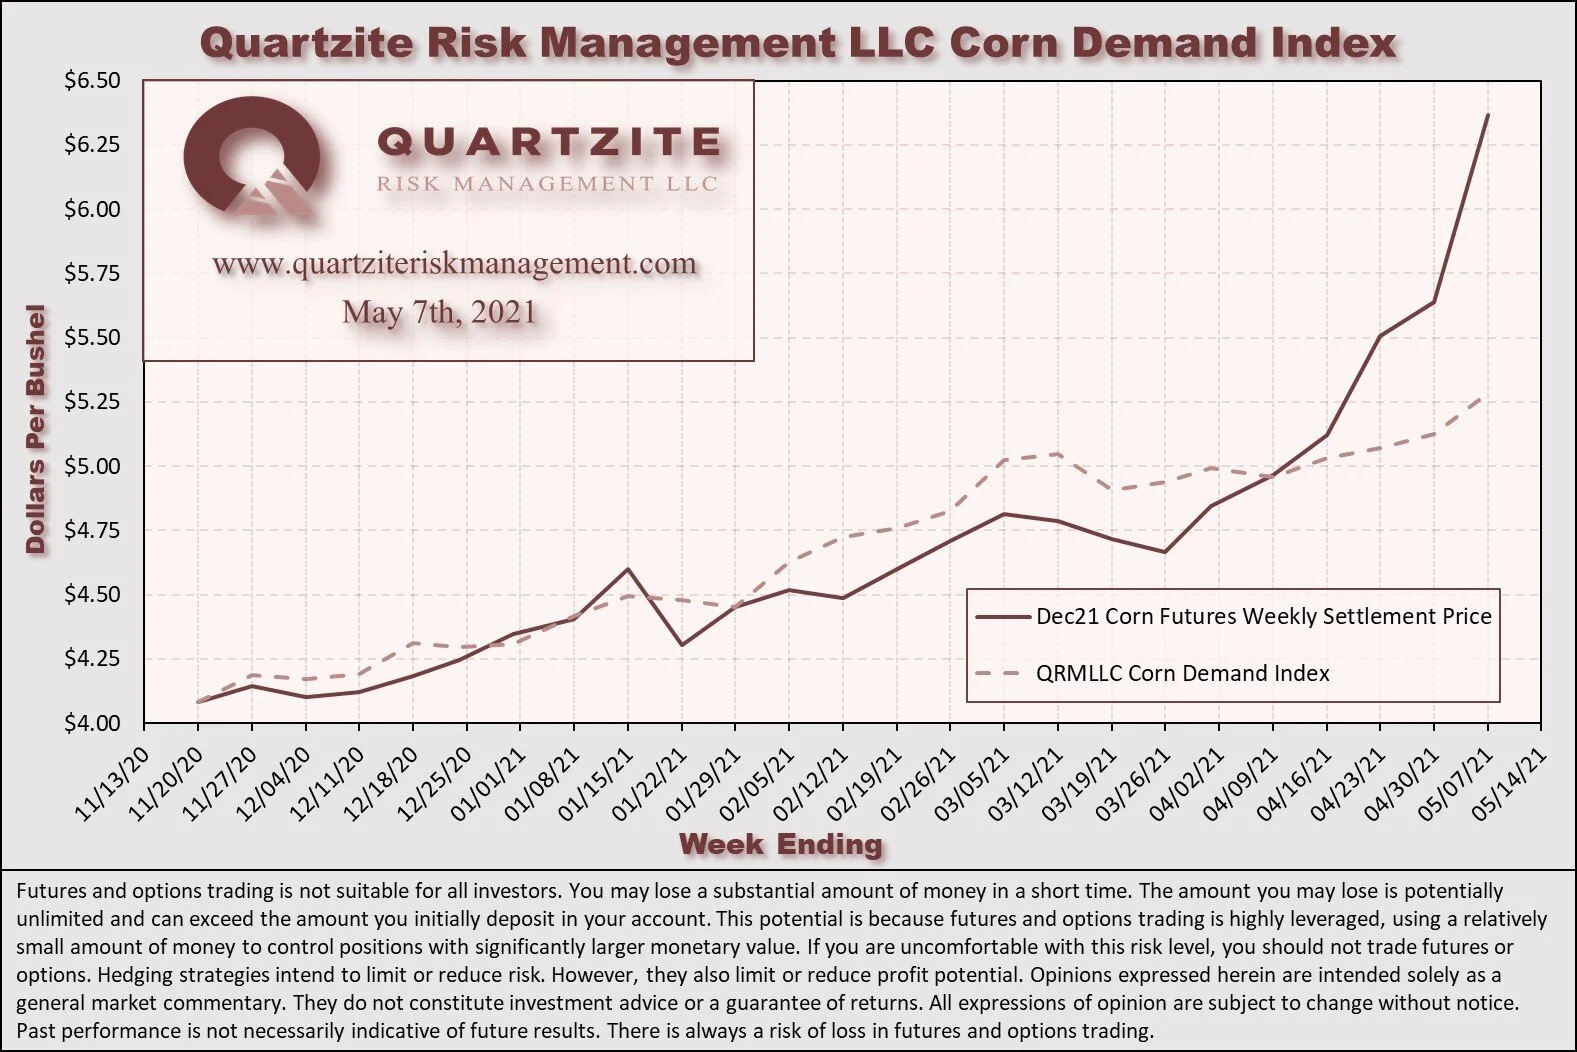
As a reminder, the Quartzite Risk Management Corn Demand Index references the weekly change in April 2022 futures for Crude Oil, Live Cattle and Lean Hogs. We weigh the percentage change in those contracts and compute the index's percentage change. Crude Oil accounts for 50% of the index, and Live Cattle and Lean Hogs each make up 25%. To create the chart, we started the index at the Dec21 corn futures settlement on 11/20/20; then added or subtracted the index's weekly percentage change. We want to add a few warnings. First, there are only a handful of data points - not much to go on. Second, the index references relatively illiquid markets - making any strategy based on it challenging to execute. Third, we expect divergences to increase as we get into the growing season when the corn market will likely look more toward supply for its direction. In short, we would not attempt to trade on this information without much more data, nor would we recommend anyone else does.