Weekly Corn Market Update 06/02/23
December 2023 (Dec23) corn futures (the benchmark for 2023 corn production) finished the week higher by 6.75 cents (~1.26%), settling at $5.4125/bushel. The week's low of $5.1125/bushel was 4.00 cents below the lower notable level we published last week.
Our corn demand index (CDI) outperformed Dec23 corn futures this week - rising 1.67%. The ratio of Nov23 soybean futures divided by Dec23 corn futures fell from 2.23 to 2.19 - the lowest weekly settlement to date in 2023. Potential instability in the US financial system, the war in Ukraine, executive branch policy, increasing tensions with China, Federal Reserve interest rate policy, and the Dollar remain concerns. The USDA releases its June World Agricultural Supply and Demand Estimates (WASDE) at 11 am CDT next Friday.
Dec23 corn futures remain in a long-term downtrend originating from the spring 2022 highs. Breaking this downtrend would require trade above the trendline extending from the highs of 04/27/22 and 10/14/22 - currently in the neighborhood of $5.80/bushel. We see technical levels below the market at around $5.25, $5.14, $4.98, $4.83, $4.63, and $4.20/bushel. We see technical levels above the market at around $5.46, $5.63, $5.71, $5.84, $6.03, $6.14, $6.31, $6.55, and $6.78/bushel. The $5.46/bushel level seems particularly important given its support of last summer's selloff and the price action after the market broke through it to the downside earlier this spring. Daily and weekly momentum indicators show mostly neutral readings, with some daily indicators edging into overbought territory. Carry spreads from Dec23 to Mar24, May24, and Jul24 were unchanged to wider this week.
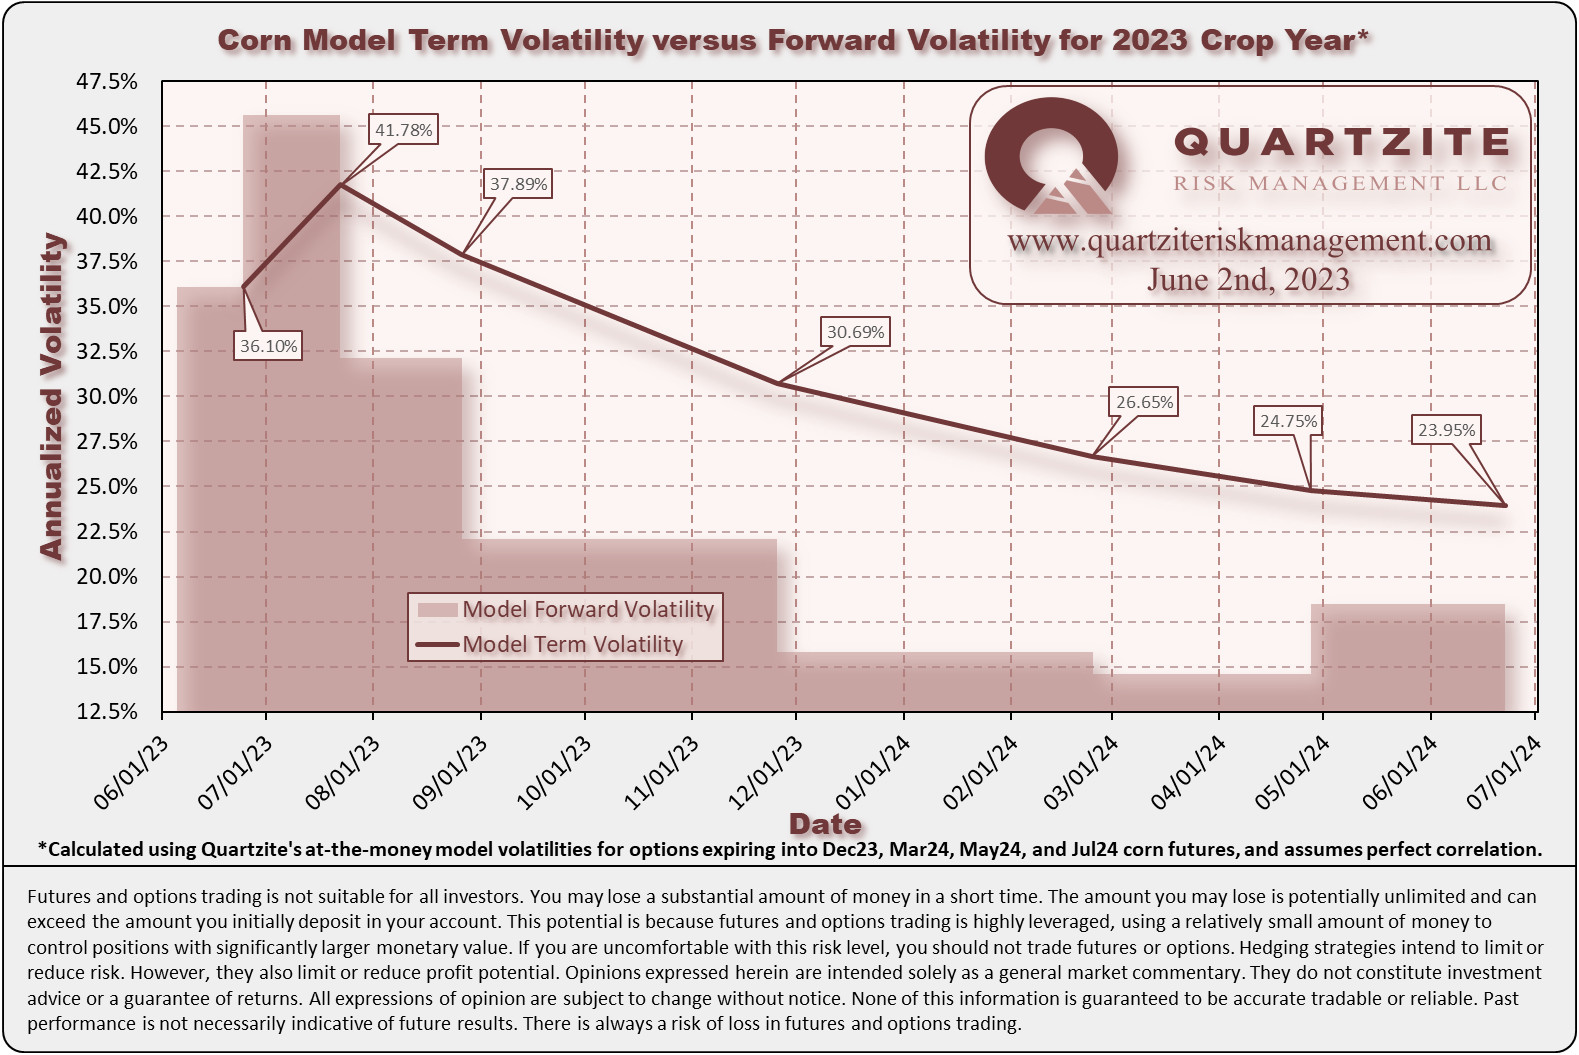
Our at-the-money model volatilities for the 2023 crop finished the week higher. Our current new crop at-the-money option volatilities from short-dated Jul23 to Dec23 are higher than comparable new crop volatilities a year ago, with Mar24 to Jul24 lower than comparable new crop volatilities a year ago. Our primary focus remains trading around our clients' established positions to capture market volatility to help offset time decay. See the charts below for more details. One compares our closing at-the-money model volatilities for this week and last. The other compares our current model volatilities with the forward volatilities they imply between consecutive expirations.
For next week's trading in Dec23 corn futures, we consider trade in the $5.1575-$5.7100 per bushel range unremarkable. Notable moves extend to the $4.8175-$6.1750 per bushel range. Price action beyond that would be extreme. Be sure to visit our Twitter page to vote in our weekly poll. While you are there, please give us a follow.
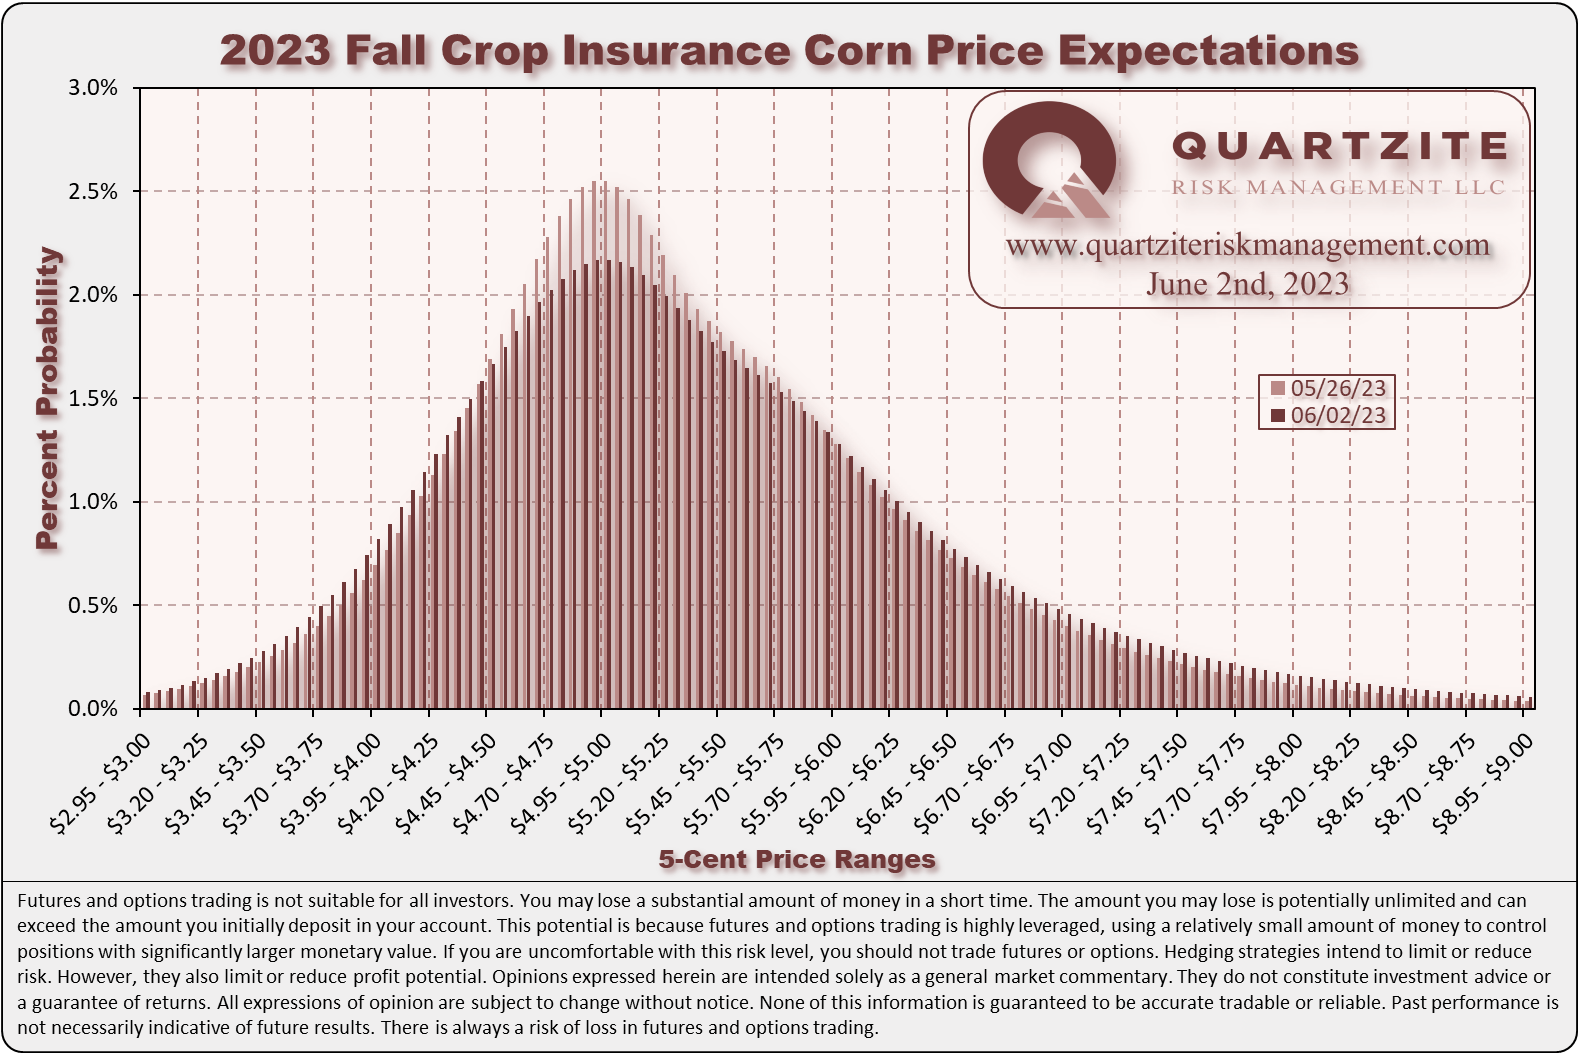
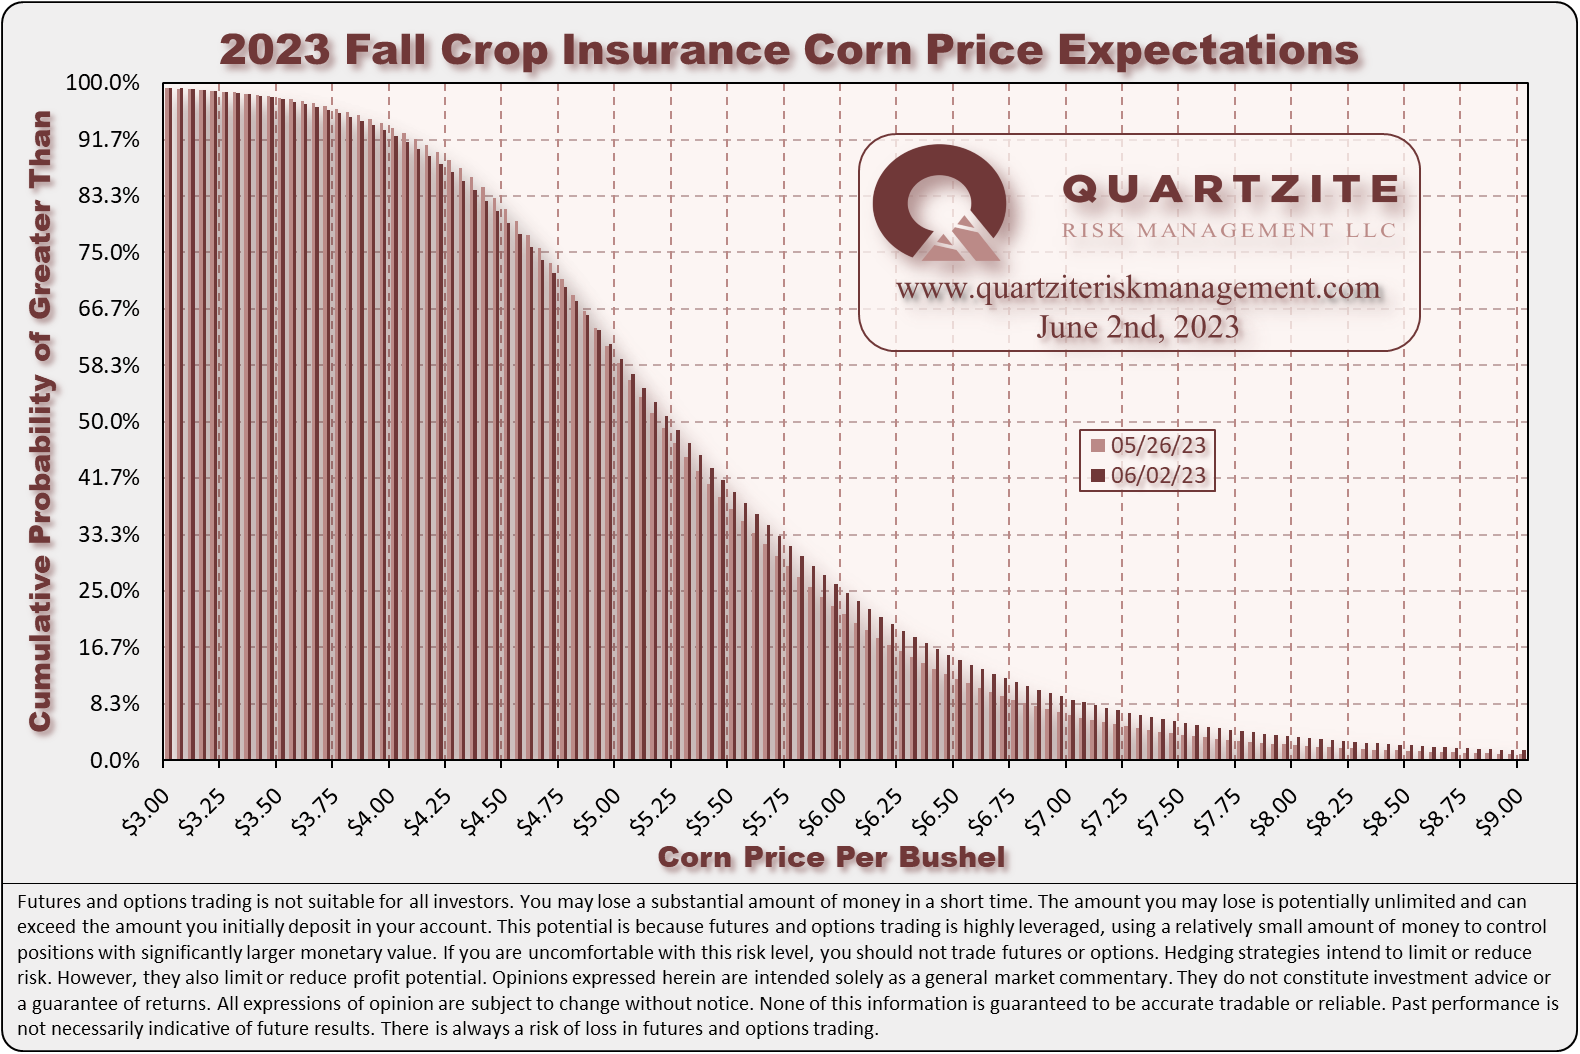
For the fall crop insurance price, we see a median of $5.2200/bushel with a mode between $4.95 and $5.00/bushel. The fall crop insurance price distribution widened with increased implied volatility this week. See the crop insurance charts below.
This week, we made one trade for our Quartzite Precision Marketing customers in the 2023 corn crop. Late on Friday, we outlaid some premium to roll out-of-the-money short-dated Jul23 puts up nearer to the money on a ratio.
If you think Quartzite Precision Marketing might be a good fit for your operation, reach out to learn more and discuss your options.
Thanks for taking the time to read. We look forward to your questions and feedback. Thanks again.
(970)223-5297 - Email - Contact Form - Twitter - Facebook
#AgTwitter & #oatt - cast your vote in this week's poll, then click over to read our Weekly #Corn #Market Update: https://t.co/qxGDJSxL6R
— Quartzite Risk Management LLC (@QuartziteRMLLC) June 3, 2023
We think these scenarios have roughly equal probability next week. Where do you think #cbot Dec23 corn #futures will settle next week?
Weekly Price Levels and Corn Demand Index


As a reminder, the Quartzite Risk Management Corn Demand Index references the weekly change in April 2024 futures for Crude Oil, Live Cattle and Lean Hogs. We weigh the percentage change in those contracts and compute the index's percentage change. Crude Oil accounts for 50% of the index, and Live Cattle and Lean Hogs each make up 25%. To create the chart, we started the index at the Dec23 corn futures settlement on 11/04/22; then added or subtracted the index's weekly percentage change. We want to add a few warnings. First, there are only a handful of data points - not much to go on. Second, the index references relatively illiquid markets - making any strategy based on it challenging to execute. Third, we expect divergences to increase as we get into the growing season when the corn market will likely look more toward supply for its direction. In short, we would not attempt to trade on this information without much more data, nor would we recommend anyone else does.