Weekly Corn Market Update 06/24/22
December 2022 (Dec22) corn futures (the benchmark for 2022 corn production) finished the week lower by 57.00-cents (~7.80%), settling at $6.7400/bushel. This week's price action took place in an 85.50-cent (~11.70%) true range. The week's low was 14.50-cents below the lower extreme band we published last week.
Our corn demand index (CDI) outperformed Dec22 corn futures this week, falling only 2.29%. Dec22 corn futures narrowed the premium to the CDI that we mentioned last week from nearly 50 cents to just under 8 cents. Based on this considerably smaller premium, it appears the market is less concerned about production issues than last week. The war in Ukraine, executive branch policy, tensions with China, Federal Reserve interest rate policy, and strength in the Dollar remain concerns. The USDA releases its Quarterly Grain Stocks, and Annual Acreage reports next Thursday - these numbers can be market movers.
Dec22 corn futures remain in a long-term uptrend supported by a trendline connecting the lows of 03/31/21 and 09/10/21. Dec22 corn futures are now back in a channel formed using the 05/07/21 high as a boundary parallel to that trendline and bounced this week from near that channel's midline. We see support below the market near $6.58, $6.47, $6.30, $5.99, $5.80, and $5.65/bushel. Significant long-term support is between $5.26 and $5.35 per bushel and would require a substantial break in the longer-term trend to test. That long-term trendline is hovering just above the $6.00 level this week. We see resistance above the market around $6.88, $7.04, $7.14, $7.27, $7.37, $7.57, and $7.66/bushel. Daily momentum indicators finished in, or nearly in, oversold territory this week, while weekly momentum indicators remained neutral. Daily Bollinger Band Bandwidth widened this week. Carry spreads from Dec22 to Mar23, May23, and Jul23 strengthened.
Our at-the-money model volatilities for the 2022 crop finished the week mostly lower, with short-dated August the only gainer. Given the high implied volatilities in the options market, we believe opportunistic spreading and careful position management are crucial to managing production uncertainty and volatility risk. See the charts below for more details. One compares our closing at-the-money model volatilities for this week and last. The other compares our current model volatilities with the forward volatilities they imply between consecutive expirations. Readers may notice that we added the October serial expiration this week since it starts trading next week. This week's charts reflect our best guess of where it should open.
For next week's trading in Dec22 corn futures, we consider trade in the $6.3050-$7.3250 per bushel range unremarkable. Notable moves extend to the $5.7875-$8.1575 per bushel range. Price action beyond that would be extreme. Be sure to visit our Twitter page to vote in the poll we hold there each week. While you are there, please give us a follow.
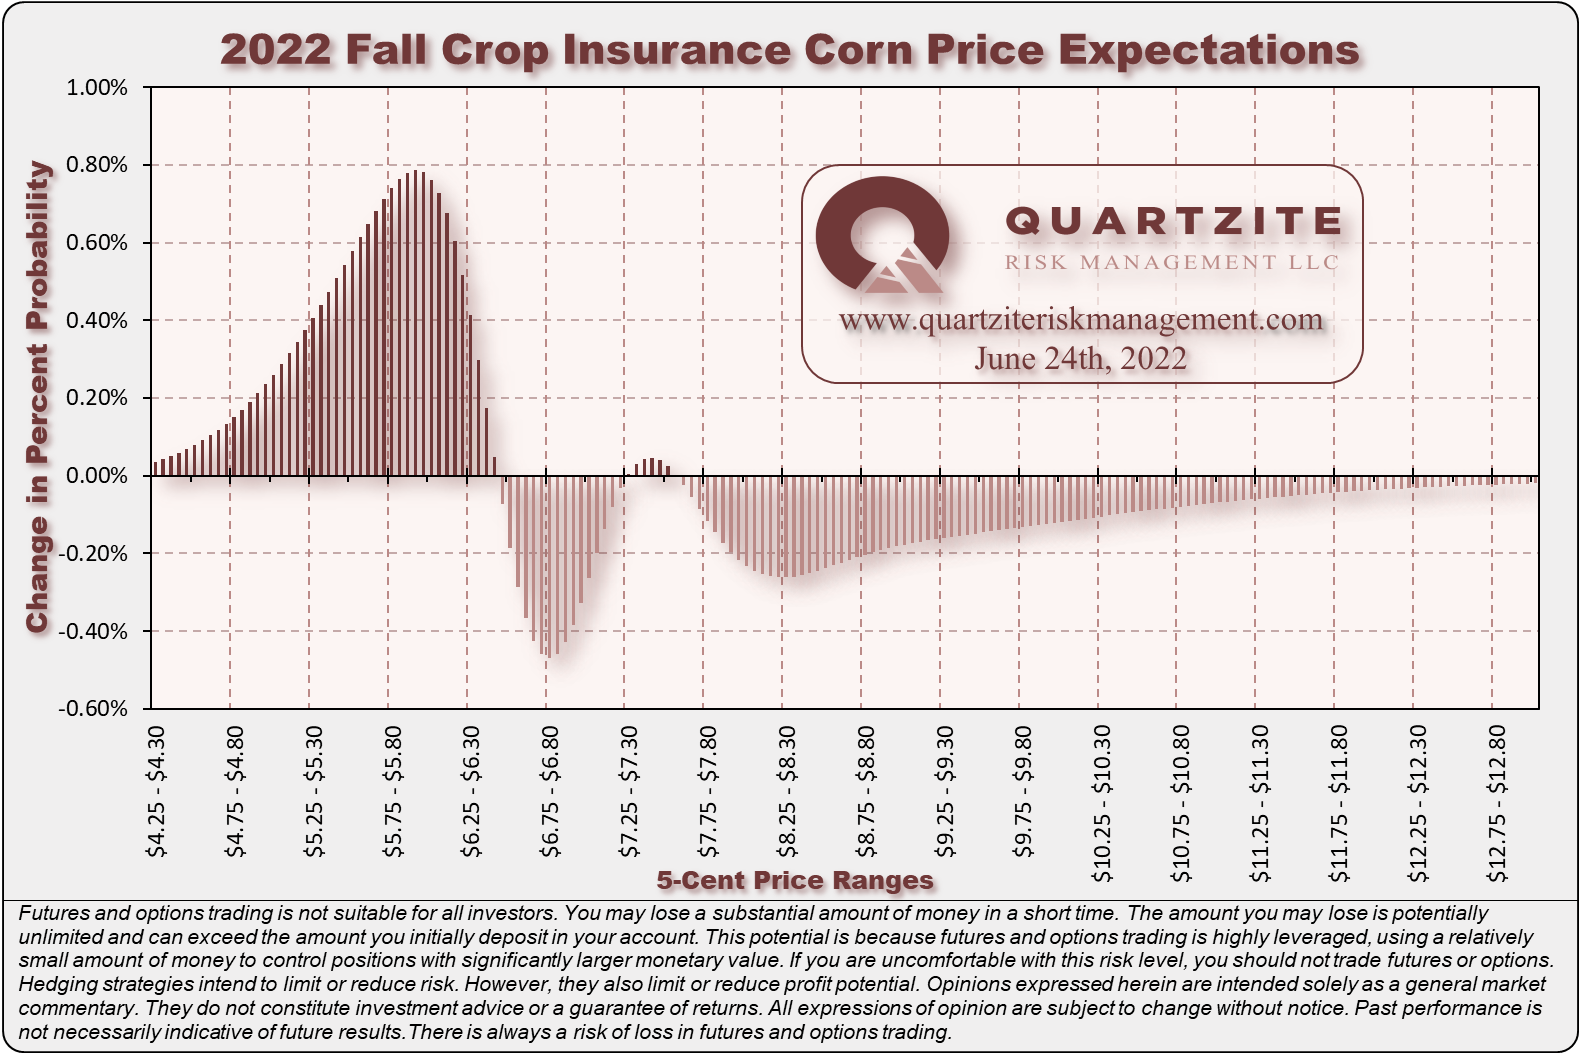
Our median Fall Price estimate is $6.4250 per bushel this week, with a mode between $6.10 and $6.15. Our Fall Price distribution shifted lower with the selloff and narrowed with decreased implied volatility.
We had an active week in the new crop corn market for our Quartzite Precision Marketing customers. During Monday night's overnight trade, we collected some premium to roll near-the-money December puts to the same strike in short-dated September. During Wednesday's day session, we collected a nice premium to move in-the-money short-dated July puts nearer to the money. We repeated the process in Wednesday night's overnight trade - rolling those now in-the-money short-dated July puts down again to near the money. On Thursday, as the market traded through our extreme downside level for the week, we closed our in-the-money and near-the-money short-dated July puts. At the same time, we spent some of the premium received from those and earlier trades in short-dated July to replace most of those put units with near-the-money short-dated August puts. We also rolled the now in-the-money short-dated September puts from Monday's night session down-and-out to near-the-money puts in December, collecting a decent premium in the process. Near Thursday's lows, we made a small purchase of dollar-cheap short-dated July call options to protect some of the week's hedging gains. On Friday morning, we flipped those calls for a small winner and used some of the profits to buy expiring short-dated July puts that ended up out of the money. It was a busy week, and we were happy with our trades and how the position performed. We still believe producers should protect their investment in expensive inputs with a disciplined and flexible risk management strategy like the one at the heart of Quartzite Precision Marketing. It may still be the right time to consider your 2022 marketing plan. If you have any questions or want to learn more about what we do, we are always happy to chat about the markets, and there is no obligation.
#AgTwitter & #oatt - cast your vote in this week's poll, then click over to read our Weekly #Corn #Market Update:https://t.co/mvKjfCcQAV
— Quartzite Risk Management LLC (@QuartziteRMLLC) June 25, 2022
We think these scenarios are equally likely for next week. Where do you think Dec22 corn #futures will settle next week?
Thanks for taking the time to read. We look forward to your questions and feedback. Thanks again. Have a great week.
(970)223-5297 - Email - Contact Form - Twitter - Facebook
Weekly Price Levels and Corn Demand Index


As a reminder, the Quartzite Risk Management Corn Demand Index references the weekly change in April 2023 futures for Crude Oil, Live Cattle and Lean Hogs. We weigh the percentage change in those contracts and compute the index's percentage change. Crude Oil accounts for 50% of the index, and Live Cattle and Lean Hogs each make up 25%. To create the chart, we started the index at the Dec22 corn futures settlement on 11/12/21; then added or subtracted the index's weekly percentage change. We want to add a few warnings. First, there are only a handful of data points - not much to go on. Second, the index references relatively illiquid markets - making any strategy based on it challenging to execute. Third, we expect divergences to increase as we get into the growing season when the corn market will likely look more toward supply for its direction. In short, we would not attempt to trade on this information without much more data, nor would we recommend anyone else does.