Weekly Corn Market Update 07/08/22
December 2022 (Dec22) corn futures (the benchmark for 2022 corn production) finished the week higher by 16.00-cents (~2.63%), settling at $6.2350/bushel. This week's price action took place in a 59.50-cent (~9.79%) range. The week's low was 10.50-cents below the lower notable band we published last week, and the settlement was within the unremarkable range.
Our corn demand index (CDI) underperformed Dec22 corn futures this week, falling 2.05%. Dec22 corn futures are still trading at a discount to the CDI, but that discount more than halved this week. Based on this discount, we still believe the market is vulnerable to a sharp rally on virtually any production concerns. The war in Ukraine, executive branch policy, tensions with China, Federal Reserve interest rate policy, and strength in the Dollar remain concerns. The USDA releases its monthly WASDE report for July next Tuesday.
Dec22 corn futures recovered from their weekly lows to remain in a long-term uptrend supported by a trendline connecting the lows of 03/31/21 and 09/10/21. Dec22 corn futures violated that trendline early in the week but regained it in Friday's trade. We see support below the market near $5.99, $5.80, and $5.65/bushel. Significant long-term support is between $5.26 and $5.35 per bushel and would require a substantial break in the longer-term trend to test. We see resistance above the market around $6.30, $6.47, $6.58, $6.88, $7.04, $7.14, $7.27, $7.37, $7.57, and $7.66/bushel. Daily momentum indicators recovered from oversold territory this week, while weekly momentum indicators remain in neutral to oversold territory. Daily Bollinger Band Bandwidth widened this week. Carry spreads from Dec22 to Mar23, May23, and Jul23 weakened.
Our at-the-money model volatilities for the 2022 crop finished the week higher. We believe October options currently represent the best value for hedgers, but high implied volatility overall will complicate hedging. Given the exceptionally high implied volatilities in the options market, we believe opportunistic spreading and careful position management are crucial to managing production uncertainty and volatility risk. See the charts below for more details. One compares our closing at-the-money model volatilities for this week and last. The other compares our current model volatilities with the forward volatilities they imply between consecutive expirations.
For next week's trading in Dec22 corn futures, we consider trade in the $5.8500-$6.7325 per bushel range unremarkable. Notable moves extend to the $5.3850-$7.4600 per bushel range. Price action beyond that would be extreme. Be sure to visit our Twitter page to vote in the poll we hold there each week. While you are there, please give us a follow.
Our median Fall Price estimate is $5.9475 per bushel this week, with a mode between $5.60 and $5.65. Our Fall Price distribution shifted slightly higher with the rally and widened with increased implied volatility.
We had another busy week in the new crop corn market for our Quartzite Precision Marketing customers. On Tuesday, we outlaid some premium to roll down the October calls we purchased as part of a straddle last Friday. We outlaid a small premium on Wednesday to roll near-the-money Short-dated September puts into October. We collected a significant premium on Thursday's strength when we made an outright sale of the October calls we rolled down on Tuesday. At nearly the same time, we added another short futures position for a client with limited access to the cash market. We collected a decent premium on Friday to roll an in-the-money December put into the same strike in October. Near Friday's close, we sold some futures for two clients. Those clients were the client with limited access to the cash market and the client for whom we made an outright futures purchase against his overall position last Friday.
Overall we were delta buyers early in the week and delta sellers on Thursday and Friday. While we would love to claim some keen foresight into the market's direction to explain those trades, there is a better explanation. These seemingly well-timed directional trades are primarily the result of the disciplined application of a modern option trading strategy around the gamma in our clients' portfolios. Trading in this way can help us offset the premiums we pay for the options we buy for our clients. We also did our best throughout the week to reduce our exposure to high implied volatility by lowering our overall option count. However, we are still net owners of options out of necessity.
We continue to believe producers should protect their investment in expensive inputs with a disciplined and flexible risk management strategy like the one at the heart of Quartzite Precision Marketing. It may still be the right time to consider your 2022 marketing plan or even begin considering your 2023 marketing plan. If you have any questions or want to learn more about what we do, we are always happy to chat about the markets, and there is no obligation.
#AgTwitter & #oatt - cast your vote in this week's poll, then click over to read our Weekly #Corn #Market Update:https://t.co/a6ybpk4mMM
— Quartzite Risk Management LLC (@QuartziteRMLLC) July 8, 2022
We think these scenarios are equally likely for next week. Where do you think Dec22 corn #futures will settle next week?
Thanks for taking the time to read. We look forward to your questions and feedback. Thanks again. Have a great week.
(970)223-5297 - Email - Contact Form - Twitter - Facebook
Weekly Price Levels and Corn Demand Index

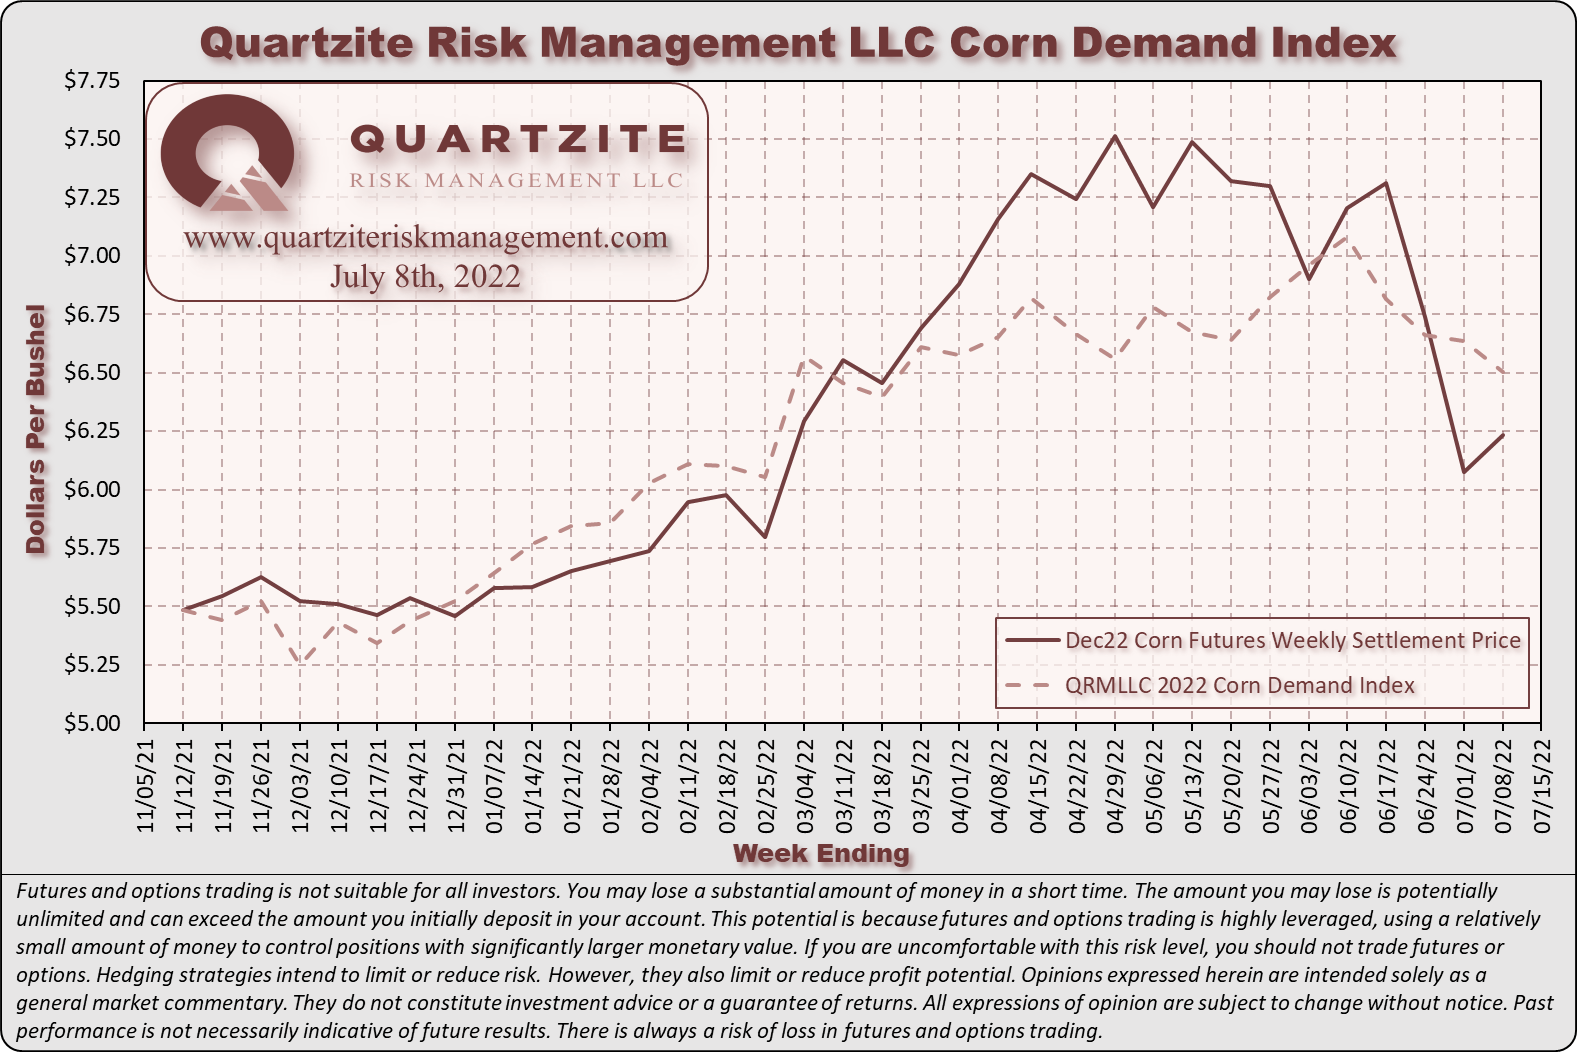
As a reminder, the Quartzite Risk Management Corn Demand Index references the weekly change in April 2023 futures for Crude Oil, Live Cattle and Lean Hogs. We weigh the percentage change in those contracts and compute the index's percentage change. Crude Oil accounts for 50% of the index, and Live Cattle and Lean Hogs each make up 25%. To create the chart, we started the index at the Dec22 corn futures settlement on 11/12/21; then added or subtracted the index's weekly percentage change. We want to add a few warnings. First, there are only a handful of data points - not much to go on. Second, the index references relatively illiquid markets - making any strategy based on it challenging to execute. Third, we expect divergences to increase as we get into the growing season when the corn market will likely look more toward supply for its direction. In short, we would not attempt to trade on this information without much more data, nor would we recommend anyone else does.


