Weekly Corn Market Update 09/10/21
December 2021 (Dec21) corn futures (the benchmark for 2021 corn production) finished the week lower by 6.50-cents (~1.24%), settling at $5.1750/bushel. This week's price action took place in a 28.75-cent (~5.49%) range. The weekly low was 4.00-cents below the lower notable level we published last week. The weekly settlement was well within our unremarkable range.
Our corn demand index (CDI) fell 1.51% this week, underperforming Dec21 corn futures for the first time in several weeks. Concerns over COVID-19 in the U.S. surrounding the Delta variant continue to drag on. The potential for problems elsewhere in the world and from new strains remains. Uncertain executive branch policy, interest rates, and their impact on the Dollar remain significant concerns. Tensions with China continue to loom. We believe these factors will continue to provide potential sources of volatility for the foreseeable future. The USDA released its monthly WASDE report on Friday. Price action following the report was choppy.
The uptrend that started from the August 2020 lows failed this week. Daily settlements violated the long-term trendline connecting the lows of 10/29/20 and 3/31/21 on every day this week. Following the monthly WASDE report on Friday, the market made a failed attempt to retake the trendline before the weekly settlement. That failure does not bode well for near-term price action. Daily and weekly momentum indicators show a mix of neutral and oversold readings. Carry spreads from Dec21 to Mar22, May22, and Jul22 narrowed this week.
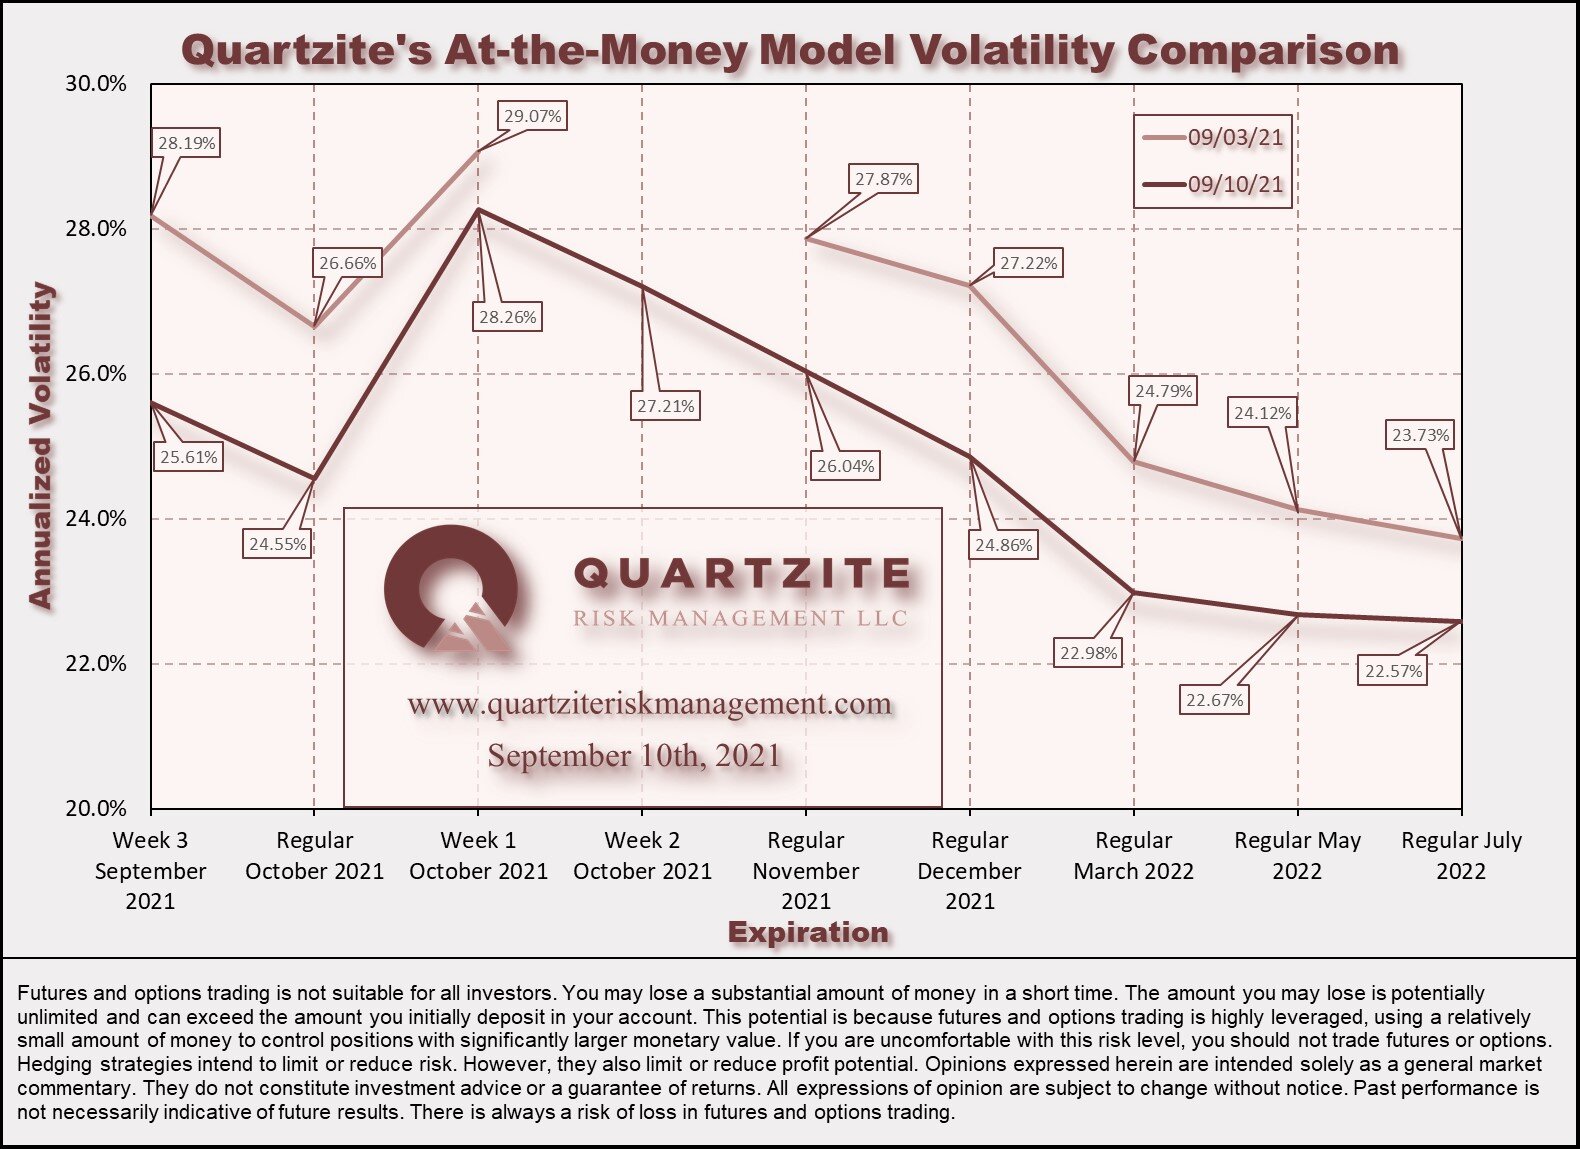
Implied volatilities for the 2021 crop finished lower for the week. Reasonable values for long-term hedgers remain challenging to find at these levels. Opportunistic spreading and careful position management are still virtual necessities to maintain the flexibility needed to manage production uncertainty and volatility risk. See the charts below for more details. One compares our closing at-the-money model volatilities for this week and last. The other compares our current model volatilities with the forward volatilities they imply between consecutive expirations.
Looking ahead to next week's trading in Dec21 corn futures, we would consider movement within the $4.9875-$5.3725 per bushel range to be unremarkable. Notable moves would extend to the $4.7675-$5.6075 per bushel range. Price action beyond that would be extreme. You will find a chart comparing these levels to the corresponding weekly price action below. Be sure to visit our Twitter page to vote in the poll we hold there each week. While you are there, please give us a follow.
Our Crop Insurance Fall Price distribution shifted lower this week due to the selloff. The passing of time and decreasing short-term implied volatility combined to narrow the distribution considerably. As we approach the Fall Price discovery period, the passage of time will continue to impact the distribution more and more each week. See below for distribution and cumulative probability charts for fall crop insurance prices and a chart highlighting the distribution's changes.
We made a few trades in the corn complex for our Quartzite Precision Marketing customers this week. On Wednesday, we made a closing sale of well-in-the-money October puts. We replaced them with twice as many slightly-out-of-the-money October Week-1 puts. We liked this one-by-two for several reasons. First, it allowed us to be net collectors of option premium. Additionally, the trade bought a week of duration, extending coverage through the quarterly number while replacing higher implied volatility with a lower one. On Friday, before and after the number, we made several trades to manage our position and several more in expiring options.
Thanks for taking the time to read. We look forward to your questions and feedback. Please feel free to contact us via our contact form, Facebook, Twitter, email, or phone at (970)294-1379. Thanks again. Have a great week.
#AgTwitter & #oatt - cast your vote in this week's poll, then click over to read our Weekly #Corn #Market Update:https://t.co/43TgQWnHpY
— Quartzite Risk Management LLC (@QuartziteRMLLC) September 12, 2021
We think these scenarios are equally likely for next week. What do you think?
Will Dec21 corn #futures settle?
Weekly Price Levels and Corn Demand Index


As a reminder, the Quartzite Risk Management Corn Demand Index references the weekly change in April 2022 futures for Crude Oil, Live Cattle and Lean Hogs. We weigh the percentage change in those contracts and compute the index's percentage change. Crude Oil accounts for 50% of the index, and Live Cattle and Lean Hogs each make up 25%. To create the chart, we started the index at the Dec21 corn futures settlement on 11/20/20; then added or subtracted the index's weekly percentage change. We want to add a few warnings. First, there are only a handful of data points - not much to go on. Second, the index references relatively illiquid markets - making any strategy based on it challenging to execute. Third, we expect divergences to increase as we get into the growing season when the corn market will likely look more toward supply for its direction. In short, we would not attempt to trade on this information without much more data, nor would we recommend anyone else does.