Weekly Corn Market Update 09/24/21
December 2021 (Dec21) corn futures (the benchmark for 2021 corn production) finished the week lower by a half-cent (~0.09%), settling at $5.2675/bushel. This week's price action took place in an 18.25-cent (~3.46%) range - the narrowest weekly range since March. All of this week's trading took place within the unremarkable range we published last week.
Our corn demand index (CDI) rose 2.19% this week, outperforming Dec21 corn futures. The CDI is now the highest it has been since we started tracking it last November. Additionally, the CDI's weekly settlement premium over Dec21 corn futures is the widest since July. The elevated outright and relative demand levels indicated by the CDI could support corn prices. However, as harvest continues, a clearing supply picture could offset the improved demand picture. Concerns over COVID-19 in the U.S. continue to drag on. The potential for problems elsewhere in the world and from new strains remains. However, the latter appears to be diminishing as the world normalizes to COVID. Uncertain executive branch policy, tensions with China, interest rates, and their impact on the Dollar remain significant concerns. We believe these factors will continue to provide potential sources of volatility for the foreseeable future. The USDA releases its quarterly Grain Stocks report next Thursday.
Dec21 corn futures failed to hold their old uptrend line this week after retaking it last week. At this point, barring any surprises in next week's Grain Stocks report or the October WASDE, we would not expect the long-term uptrend to resume. Daily and weekly momentum indicators show mostly neutral readings. Carry spreads from Dec21 to Mar22, May22, and Jul22 widened this week.
Implied volatilities for the 2021 crop finished higher for the week, with the front of the curve leading the charge in front of next week's Grain Stocks report. Reasonable values for long-term hedgers remain challenging to find at these levels. Opportunistic spreading and careful position management are still virtual necessities to maintain the flexibility needed to manage production uncertainty and volatility risk. See the charts below for more details. One compares our closing at-the-money model volatilities for this week and last. The other compares our current model volatilities with the forward volatilities they imply between consecutive expirations.
Looking ahead to next week's trading in Dec21 corn futures, we would consider movement within the $5.0350-$5.5125 per bushel range to be unremarkable. Notable moves would extend to the $4.7125-$5.8500 per bushel range. Price action beyond that would be extreme. You will find a chart comparing these levels to the corresponding weekly price action below. Be sure to visit our Twitter page to vote in the poll we hold there each week. While you are there, please give us a follow.
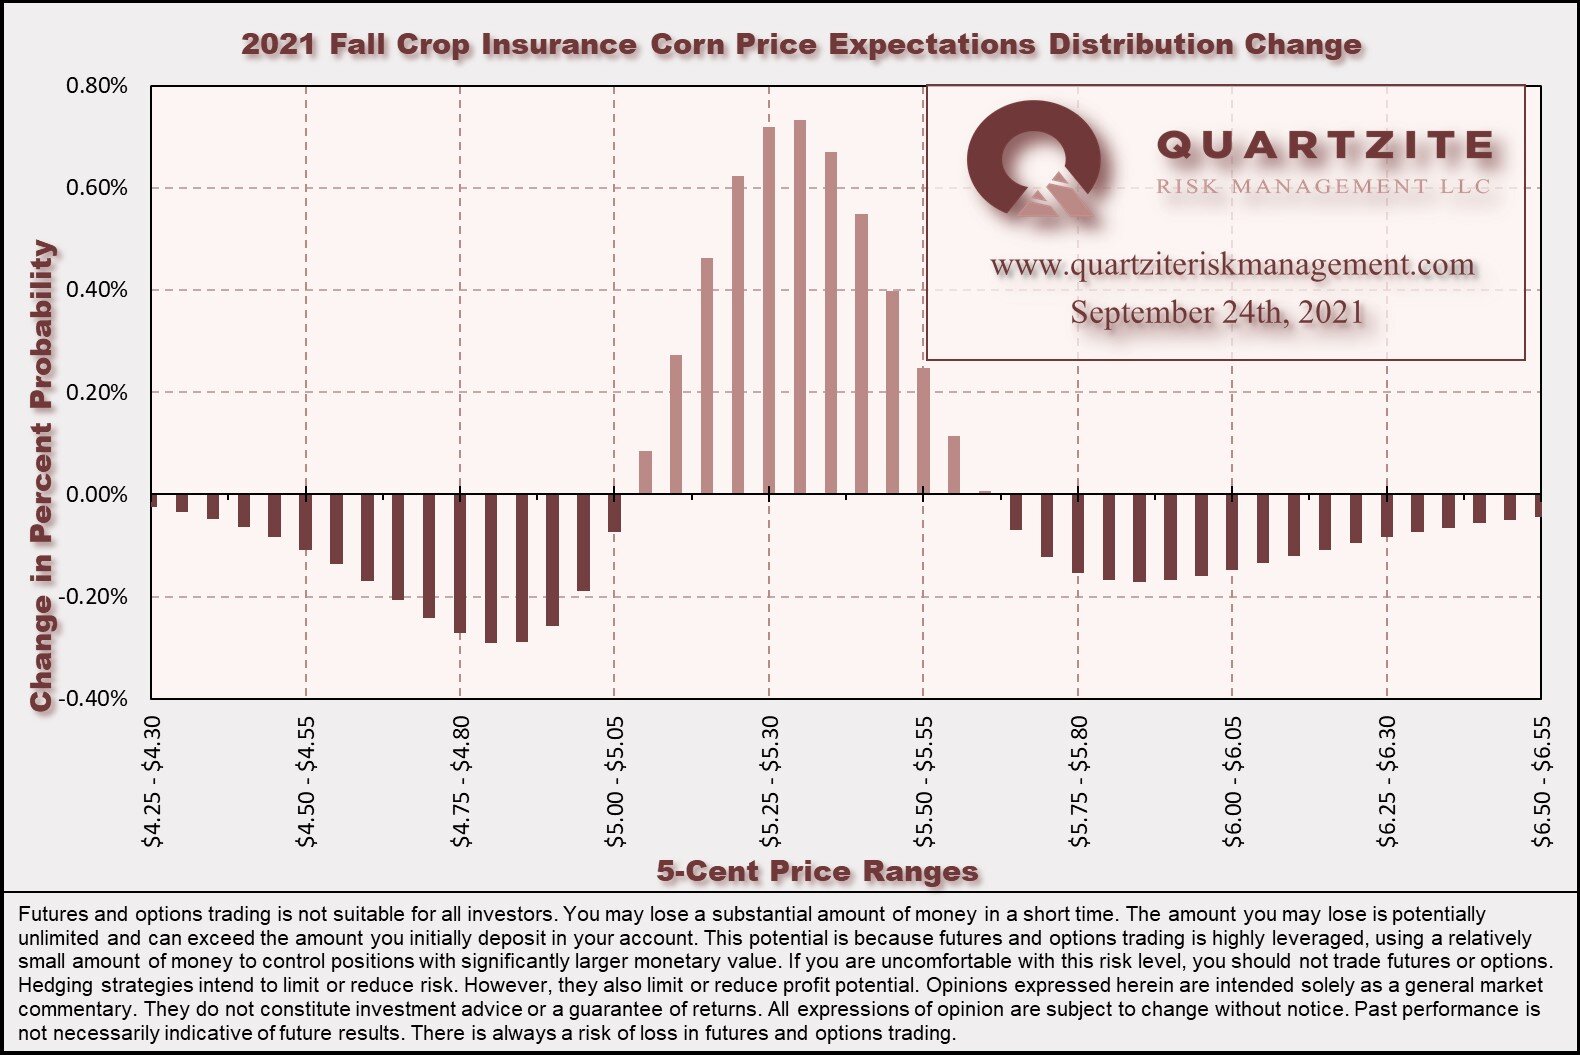
Our Crop Insurance Fall Price distribution narrowed this week as the passing of time outpaced increasing implied volatility. The discovery period for the Fall Price begins next Friday. As we approach the Fall Price discovery period, the passage of time will continue to impact the distribution more each week. See below for distribution and cumulative probability charts for fall crop insurance prices and a chart highlighting the distribution's changes.
We made no trades in the corn complex for our Quartzite Precision Marketing customers this week.
Thanks for taking the time to read. We look forward to your questions and feedback. Please feel free to contact us via our contact form, Facebook, Twitter, email, or phone at (970)294-1379. Thanks again. Have a great week.
#AgTwitter & #oatt - cast your vote in this week's poll, then click over to read our Weekly #Corn #Market Update:https://t.co/m2e8VpAhD2
— Quartzite Risk Management LLC (@QuartziteRMLLC) September 25, 2021
We think these scenarios are equally likely for next week. What do you think?
Will Dec21 corn #futures settle?
Weekly Price Levels and Corn Demand Index


As a reminder, the Quartzite Risk Management Corn Demand Index references the weekly change in April 2022 futures for Crude Oil, Live Cattle and Lean Hogs. We weigh the percentage change in those contracts and compute the index's percentage change. Crude Oil accounts for 50% of the index, and Live Cattle and Lean Hogs each make up 25%. To create the chart, we started the index at the Dec21 corn futures settlement on 11/20/20; then added or subtracted the index's weekly percentage change. We want to add a few warnings. First, there are only a handful of data points - not much to go on. Second, the index references relatively illiquid markets - making any strategy based on it challenging to execute. Third, we expect divergences to increase as we get into the growing season when the corn market will likely look more toward supply for its direction. In short, we would not attempt to trade on this information without much more data, nor would we recommend anyone else does.